The policy paper issued by the Romney campaign has received a rather harsh reaction since its release. Brad Delong provided the most well-researched and in-depth response (which should probably be called a very thorough smack-down), but there were others (see here and here).
Most telling, a reporter contacted the economists cited in the report as in one way or another supporting the Romney camp's claims, who responded like this:
Each of these sections include supporting documents from independent
economists. And so I contacted some of the named economists to ask what
they thought of the Romney campaign’s interpretation of their research.
In every case, they responded with a polite version of Marshall
McLuhan’s famous riposte. The Romney campaign, they said, knows little
of their work. Or of their policy proposals.
The real point of controversy for me was this assertion by the four idiots:
The negative effect of the administration’s ‘stimulus’ policies has been
documented in a number of empirical studies. Research by Atif Mian of
the University of California, Berkeley, and Amir Sufi of the University
of Chicago showed that the cash-for-clunkers program merely moved new
car purchases ahead a few months with no lasting effect.
DeLong responded thusly:
Such policies are supposed to shift demand forward in time into
periods where the crisis is acute from future periods in which, it is
hoped, demand is less slack. When Mian and Sufi present their work, they
characterize it not as showing the failure but rather the success of
programs like CFC.
In actuality, of the studies done on the effect of the stimulus, 13 of 15 found it worked. Put another way, "a number of empirical studies" does not support the conclusion that the stimulus didn't work. In fact, the exact opposite is true. Andfor God's sake -- the textbook written by one of the authors of the study (Greg Mankiw) argues for stimulus in the event of recession (Mankiw's place in the study has been criticized by Professor Marc Thoma, who asked, "Why would someone undermine their professional reputation defending Romney's indefensible economic policies? What's the expected payoff?).
But more to the point, I'm still amazed at the continued existence of the "stimulus doesn't work" argument because it does -- clearly and effectively.
How do we know this?
First consider that the effect of fiscal stimulus during the great depression:
You'll notice that GDP returned to 1920 levels by 1937. That's a very positive effect.
Then there is the experience of China during the last recession, which spent about 1/3 of their GDP on stimulus, leading to strong growth rates.
And as for the countries that are in the middle of an austerity program right now? They're all slowing down or in recession (see the UK as a prime example). And about the "Baltic miracle" -- you might want to look at the data because the US economy is actually performing better than they are.
Here's the deal: counter-cyclical stimulus spending works. It worked in the Depression. It worked for the Chinese in 2008. The vast majority of studies (13 of 15 or 86.7%) say it worked. The opposite fact pattern -- austerity programs -- leads to contraction.
Now the quote comes from a paper prepared for the Romney presidential campaign. It is clearly political in tone and intent. As both academics are Republican supporters, it may therefore seem par for the course. But it should not be. The Romney campaign publicised this paper because it was written by academics – experts in their field. It allows those who oppose fiscal stimulus to continue to claim that the evidence is on their side – look, these distinguished academics say so.
It is one thing for economists to disagree about policy. It would also be fine to say I know the evidence is mixed, but I think some evidence is more reliable. It is not fine to imply that the evidence points in one direction when it points in the other. I say here imply, because the authors do not explicitly say that the majority of studies suggest stimulus is ineffective. If they chose their words carefully, then you have to ask whether ‘intending to mislead’ is any better than ‘misrepresenting the facts’. Was that the intent, or just an isolated unfortunate piece of bad phrasing? All I can say is read the paper and judge for yourself, or this post from Brad DeLong.
This is sad, because it tells us as much about economics as an academic discipline as it does about the individuals concerned. In the past I have imagined something similar happening in physics. It actually stretches the imagination to do so, but if it did, the academics concerned would immediately lose their academic reputation. The credibility of their work would be questioned. Responding to evidence rather than ignoring it is what distinguishes real science from pseudo science, and doctors from snake oil salesmen.
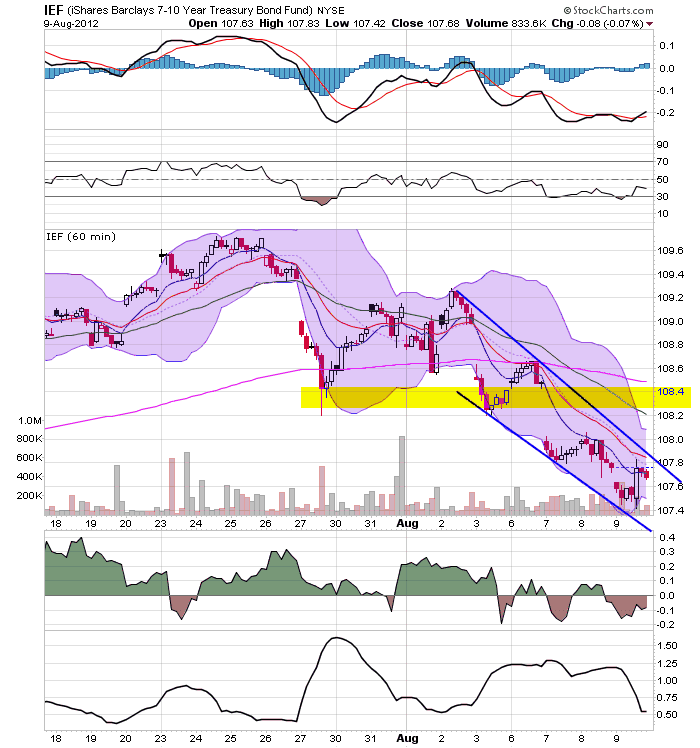
The 60 minute charts of the major sectors of the treasury market show that prices have moved through support and are all now in downward sloping channels.
We also see it in the daily charts, all of which have bearish characteristics: declining MACDs, declining shorter EMAs (the 10 and 20), weakening RSIs and declining CMF readings.
The point of the above charts is that with the bond market now breaking long-term uptrends, money will be freed to flow into the equity and other risk markets.
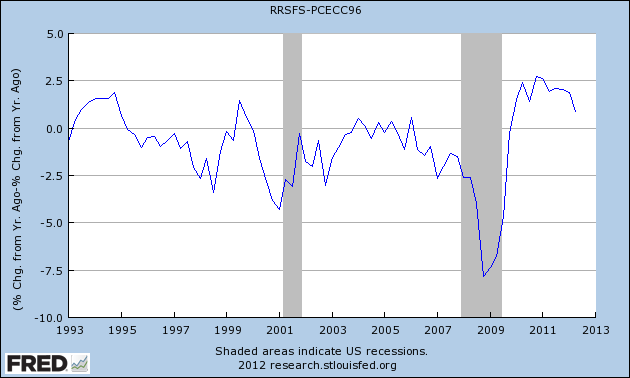
early in economic expansions, YoY real retail sales growth far outstrips YoY PCE growth. As the economy wanes into contraction, YoY real retail sales grow less and ultimately contract more than YoY PCE's. You can see that by noting that retail sales minus PCE's are always negative BEFORE the economy ever tips into recession. That's 11 of 11 times. Further, in 10 of those 11 times (1957 being the noteworthy exception), the number was not just negative, but was continuing to decline for a significant period before we tipped into recession. This makes perfect sense, as retail sales generally include many far more discretionary purchases. As the economy accelerates, consumers make more discretionary purchases. As it slows, the more discretionary retail purchases are the first things cut.
So, now that we have one more quarter's worth of data, what does the relative strength of the two consumer spending metrics tell us? Here's the updated graph:
YoY growth in real retail sales still outstrips YoY growth in the wider category of PCE's. At least as of the end of the second quarter, this metric still indicates an expanding economy.
- by New Deal democrat
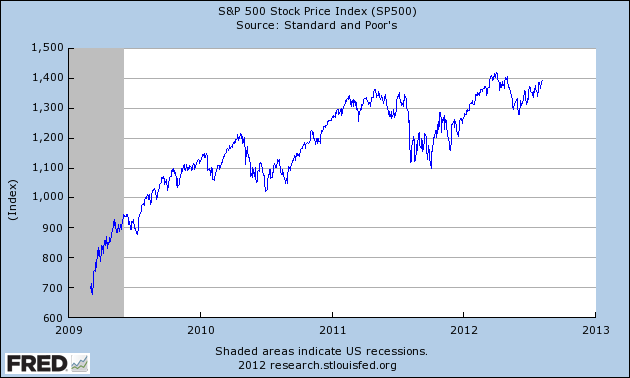
As most everyone knows, the stock market is a leading indicator for the economy. A cursory look at its growth since the March 2009 bottom shows that its advance has slowed over the last year or so, as if it were approaching the crest of a rounded hill:
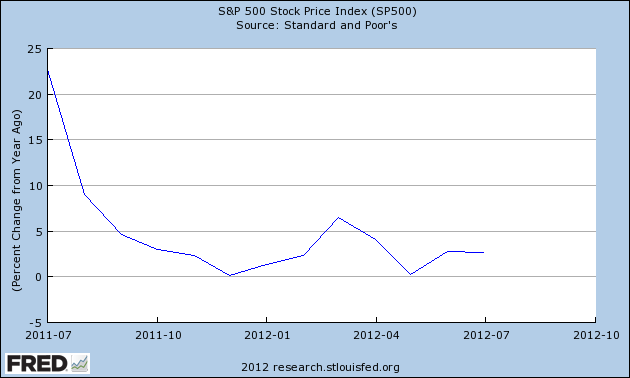
A graph of its YoY growth rate shows that indeed the rate of growth has slowed to the point where for the last year, the rate of YoY advance has meandered generally between 0% and 5%:
Here's a close-up focusing on the last 13 months, smoothed to its monthly average better to show the trend:
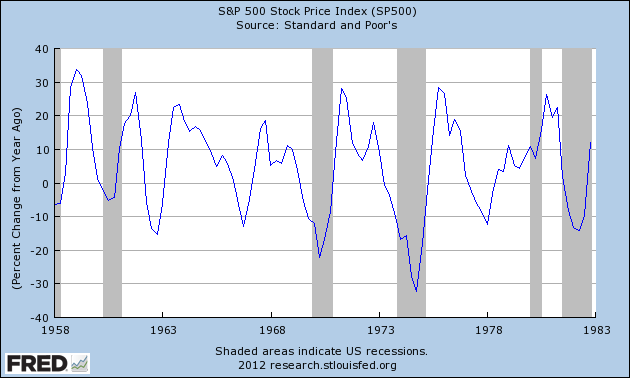
In the past, this paltry a rate of growth has been a sign of either a recession or at very least a "growth recession." Here's the YoY% change in the S&P 500 from 1958 through 1982:
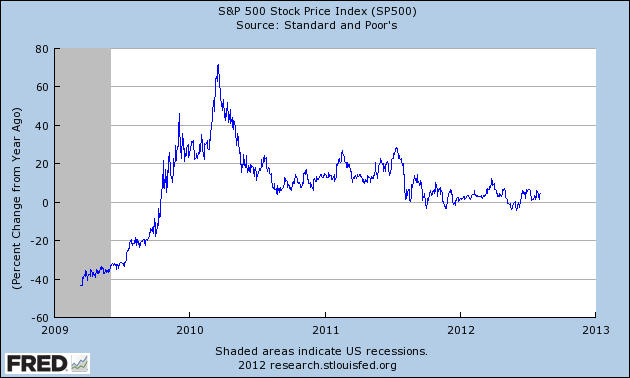
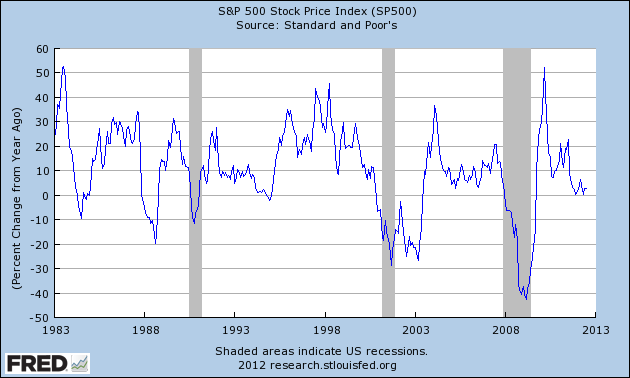
And here it is from 1983 to the present:
Recessions have always been accompanied by negative YoY stock market returns. Zero to 5% growth has sometimes been a harbinger of recession, but just as often - for example, 1966, 1984, 1994, and 1998 - has been associated with periods of slow growth or financial distress.
The present period of poor growth has existed for 11 months, showing that this is a more serious concern than during the 2010 "double-dip" panic.
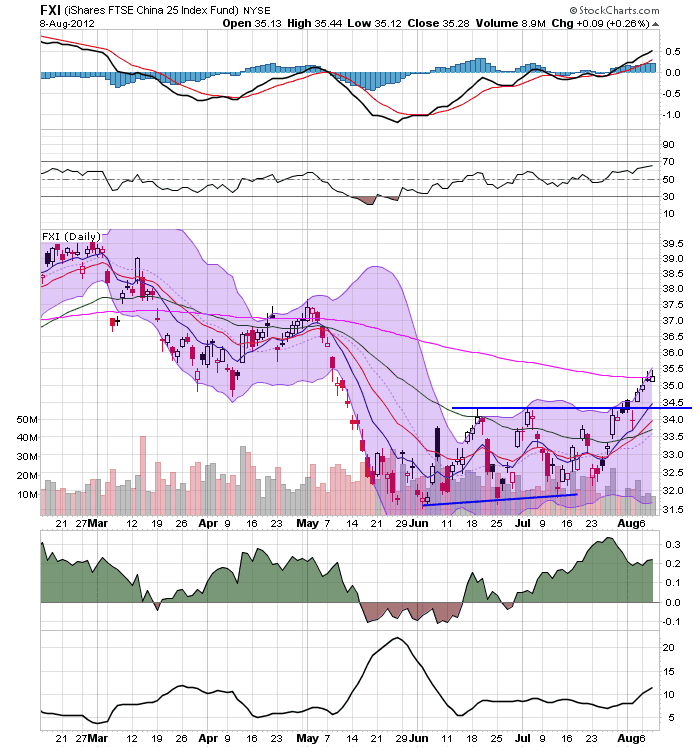
Both the Brazilian market (top chart) and Chinese market (bottom chart) have broken through resistance. The Brazilian market recently made the move; also note the rising short term EMAs (the 10 and 20 day) and that prices are above all the shorter EMAs. Also note the rising MACD and positive CMF. The Chinese market is right at the 200 day EMA. The 10 and 20 day EMAs have moved through the 50 day EMA and the CMF is positive.
The junk bond market is still in the middle of a multi-year rally. All the EMA are moving higher and momentum is positive. This move is to be expected, as the yields on treasuries are so low.
It looks like the industrial metals market is trying to bottom. We see a bottom around the 17.25/17.50 area and a descending top connecting the highs established in July. Also note the narrowing Bollinger Band numbers for July, indicating that volatility is dropping.
Oil bottomed at the end of June/beginning of July and has been rising since. Prices first hit the 200 day EMA in mid-July and is now rallying to that number again. The shorter EMAs have moved through the 50 day EMA.
Yesterday, I noted that every region in the world is being hit by a growth slowdown. The BRIC model of growth is producing diminishing returns, Europe is mired in what I believe to be their version of the US Constitutional Crisis and the US is dealing with the after-effects of a debt-deflation, economy wide credit bust. Today, I want to address what can be done about this -- if anything. Let me answer this by addressing the US' problems, followed by Asia's and than Europe's.
The US issues are actually fairly easy to deal with. Standard macro states that in the event of a credit bubble burst, counter-cyclical federal spending is in order. This will not be a new thought to readers of this blog, but it does need repeating as the "leaders" in Washington (and I use that term very liberally) are mired in their own stupidity. The US has several advantages right now: ultra-low government bond rates, a high level of blue collar unemployment and a massively out-of-date and dilapidated infrastructure. As one example of the latter, the Washington Post recently ran a story called, "Aging Power Grid on Overload As US Demands More Electricity," which noted:
The United States doesn’t yet face the critical shortage of power
that has left more than 600 million people in India without electricity
this week
But the U.S. grid is aging and stretched to capacity.
More often the victim of decrepitude than the forces of nature, it is
beginning to falter. Experts fear failures that caused blackouts in New
York, Boston and San Diego may become more common as the voracious
demand for power continues to grow. They say it will take a
multibillion-dollar investment to avoid them.
“I like to think of
our grid much like a water system, and basically all of our pipes are at
full pressure now,” said Otto J. Lynch, vice president of
Wisconsin-based Power Line Systems,
“and if one of our pipes bursts and we have to shut off that line, that
just increases the pressure on our remaining pipes until another one
bursts, and next thing you know, we’re in a catastrophic run and we have
to shut the whole water system down.”
As I've noted on more than one occasion, the American Society of Civil Engineers has given the US infrastructure a grade of "D." You also might want to watch a program called, The Crumbling of America, which ran on the History Channel, which highlights the infrastructure problems we face.
Right now the US can borrow at record low rates (the markets are, in fact, basically asking as to take their money), rebuild its infrastructure, hire a ton of unemployed manufacturing and construction workers and rekindle demand. We can also rehire a large number of teachers, police officers and other public servants who provide services we all extol but are seldom willing to pay for.
The Asian problem can initially be dealt with through a round of interest rate cuts. Consider the following levels of benchmark rates from around the region:
As the blog Money Illusions has noted in the past, the Australian central bank has been far more prone to lower rates in anticipation of coming problems, rather than waiting for the economy to falter and then act. I believe both China and South Korea also fall into that category -- banks that will and have demonstrated a proclivity to proactively manage and direct monetary policy to "lean against the wind." None of these economies are in terrible shape: China's latest Y/O/Y percentage change in GDP growth was 7.6%, Australia's was 4.3%, Taiwan's was -.16% and South Korea's was 2.4%. However, all are slowing and need an additional push which lower interest rates should help to accomplish.
The above problems are actually pretty easy to deal with -- at least for those of us writing on a blog. In practical matters, they are harder to implement because the powers that be are typically pretty useless. Now we move to the more intractable problems.
Two BRIC countries -- India and Russia -- face pretty daunting political problems that may be impossible to overcome. India's political system is mired in a level of gridlock and graft, as noted by the Economist:
But India's slowdown is due mainly to
problems at home and has been looming for a while. The state is
borrowing too much, crowding out private firms and keeping inflation
high. It has not passed a big reform for years. Graft, confusion and red
tape have infuriated domestic businesses and harmed investment. A
high-handed view of foreign investors has made a big current-account
deficit harder to finance, and the rupee has plunged.
Russia has a different problem. As recently noted by Barry Ritholtz over at the Big Picture Blog, (I'm paraphrasing here), there is no population in the world that has been more screwed over than the Russians, first by the Czars, than the communists and finally the mob. Russia was lucky in the fact that they had oil, which helped them to grow with the other BRICs. But needed reforms in the area of property rights and corruption have not been forthcoming. The country has grown since the recession, but at far slower rates (between 3.8% and 5) than their BRIC brethren. Until they pass and implement meaningful reform, they may fall back to their previous status as a country that really should do better, but can't.
China and Brazil are in an interesting situation. Both have seen tremendous growth over the last 10-20 years. But that growth is now petering out. Part of the reason for the slowdown is the overall global slowdown: China supplies manufactured goods to the developed world, while Brazil supplies raw materials to China. When the developed world slows, the demand for both country's goods understandably drops. But both also face an overall slowing growth rate, largely because of their own success; both countries now have a middle class (which was the primary object of their growth spurts) but both also face a slowing growth curve as the middle class now wants to spend a bit of its savings and enjoy its leisure. The growth of the middle class also means that international labor arbitrage is less likely to be used by corporations in moving to these countries. In addition, as China shifts to a more consumer driven economy, commodity exporters like Russia and Brazil will have lower demand for their goods.
In short, it's distinctly possible that the era of the fast growing BRICs is simply over. The situation is explained very well in this video from the Economist:
While other countries are now taking up the rapid growth mantel (Turkey, Columbia, Peru and Vietnam) these countries are simply too small to meaningfully impact world growth.
And finally, there is Europe. I previously noted that Europe is currently in a situation akin to the US under the Articles of Confederation. We have a group a states who have created a liberalized trading code between themselves, but who also lack enough centralized authority to meaningfully implement effective macro level policy. The Greek situation is a great example of this problem. Greece has been fiscally reckless for some time (as in years); their budgetary policies were usually in violation of some EU covenant. However, the central EU authority didn't have the requisite political power to stop Greece from enacting policies that violated EU dictates. So, the only way to actually solve the problem occurred when Greece was ready to default on its debt. Also consider the policy problem faced by the ECB; they have to set interest rate policy for strong countries like Germany and weak countries like Greece and Spain. In short, it's an insane proposition from a policy implementation perspective.
The EU needs to implement it's own version of the US' constitutional convention. They need to establish a new series and set of responsibilities and relationships between the central government and the individual countries. And this will mean the individual countries ceding a certain about of power to the central government. There is no other way for the group to survive without it.
In making this call, the primary objection would be that the convention could lead to a break-up of the union, which could lead to a world-wide recession or depression. I would have to concede that point on a theoretical level but not a practical. The union has already been in place for over 15 year; institutions and norms have already been developed and implemented. Integration has already taken place on numerous levels which can't be undone. In short, the union has come too far to stop now.
To sum up, we have the following propositions.
1.) The US needs to engage in infrastructure spending. Although easily conceived, practically impossible to implement considering the political players involved.
2.) The BRICs are no longer the source of massive global growth. While a lowering of interest rates in each region would help to mitigate the overall slown all the countries are experiencing, the basic model of growth in these countries is fundamentally changing. China is changing to a consumer led economic model, which is lowering its demand for commodities, thereby lowering the growth rate of other BRICs. More intractable problems in Russia, India and Brazil further hinder the possibility of a return to rapid growth.
3.) The EU has serious structural problems that need to be overcome. While their integration has come too far to be undone, the continent may lack the overall political will to meaningfully solve their problems in the short or medium term.
Put another way, muddling growth is probably here to stay for awhile.
Over the last few days, we've been watching the markets to see if the equity markets are going to start breaking out. Let's take a look at the charts to get an idea for what's happening.
The IWMs (top chart) has broken out, but the candle is very weak and volume could be stronger. On the plus side, the MACD is about to give a buy signal. The QQQs (middle chart) are by far the best chart; they've printed several days of rising prices after a move through resistance. The SPY's (bottom chart) have also moved through resistance, but, again, the bars are weak.
It's important to remember that there are ideal breakouts (those that only occur in texts and theory) and those that occur in real life in real time. The good news is two charts (the QQQs and SPY) have moved through resistance. The bad news is the charts aren't ideal. That doesn't mean the move isn't legitimate, but it does mean we'd like to see a stronger move before saying this is a legitimate break.
Let's look at the treasury market to see if we're getting any confirmation.
The IEIs (top chart) were above their trend line earlier in the week, but are now below it. The IEFs (middle chart) have made another move lower, as have the TLTs (bottom chart). Also note the continued deterioration in each respective MACD and CMF.
These three charts above add more credibility to the argument that the equity markets are moving higher.
Over the last few weeks, both NDD and I have taken a pretty exhaustive look at the world's economies. It started with my look at the Beige Book (see here for conclusion with links to various sub-parts) and NDDs look at the 2012 situation. I also looked at Asia and the EU. All of these reports had the same conclusion: growth was grinding slower. There is no sign of immediate or imminent collapse, but there is also no sign of any period of rapid growth. In short, we're stuck in the mud with no apparent way out. However, the question to ask is this: how did we get here, why is it happening and how do we get out?
It's first important to understand that we're in the middle of a post credit bubble expansion. That means we're dealing with a very different set of economic variables than a fed induced recession and recovery. In the latter, the Fed raises rates to squash inflation, and then lowers rates to stimulate growth. This is part and parcel of basic central bank theory and has been occurring for the better part of the our post WWII economic history. However, now we're dealing with a credit deflation recovery, which is characterized by far slower growth. The reason for this is actually pretty simple: consumers (who account for about 70% of US economic activity) are trying to pay down debt in addition to spending for various items. As such, consumer growth is lower, creating a demand vacuum. Until the total debt level reaches lower levels, lower consumer spending will be the norm, leading to slower growth. This fact-pattern was outlined in the Debt Deflation Theory of the Great Depression.
But there are two other contributing set of facts. The first is Europe. More has been written on this than I care to link to, but the basic problem is one of economic union without fiscal union. Put another way, goods and services now move in a far freer manner throughout the region, but each geographical unit still has tremendous fiscal control over its own affairs. It is this latter situation creating the problems as some countries (Greece) have been very reckless, while others have simply been in the wrong place at the wrong time (Spain). However, each country has just enough autonomy to make resolution incredibly difficult. Moreover, in order to realistically solve the problem, countries in general are going to have to give up a certain degree of fiscal sovereignty -- not exactly the kind of platform any politician wants to run on. But the easiest way to solve the problem (breaking up the union) is also not really in the cards as union has already come too far to stop now. And just to make the situation that much more convoluted, the politicians who should be solving the problem don't really seem to have any desire to step up to the plate and, well, solve the problems (see this commentary from Tim Duy as an example). I think the best analogy I can think of is to the US under the Articles of Confederation.
The second problem is that the BRIC method of expansion is running out of steam. It used to be that the BRIC's used their cheap labor (China and India) and abundant raw materials (Russia and Brazil) to rapidly grow, expanding the middle class and raising the respective country out of third world status. However, this model is running out of power, largely because of its overall success. China's labor costs are rising to the level where they are no longer as competitive on the world stage. India and Russia have political problems of the highest order. India's central bank has refused to lower rates despite slower growth partially because of inflation, but more so because of the government's overall intractable inability to solve big problems. Russia is still deeply corrupt to such a degree as to make expansion into the market a very dicey affair. And Brazil is slowing because its raw materials are needed to a lower degree than before because of slower growth. In short, the BRICs need to find a new model of expansion, and no one seems to be forthcoming with the next big thing.
To sum up, all major economic regions are now dealing with incredibly difficult and nuanced problems, none of which offer easy solutions. The US consumer still has to pay down his debt; Europe needs to politically integrate further (meaning each country has to give up a certain degree of sovereignty) and the BRIC countries need to find a new model of growth. None of this situations will be resolved quickly, leaving us where we started: stuck in the mud.
Remember, in the US markets, we're on the verge of seeing important downward trend breaks in the bond market and upward trend breaks in the stock markets. Let's see if these respective markets have made an major advances.
The QQQs have made a technical advance. However, notice the weak bar and weak volume reading. While no chart is perfect, this one has a fair amount to be desired.
The SPYs are in the same position; while prices have technically advanced, they really haven't made a strong enough advance from a technical perspective for this to count -- at least not yet.
And the IWMs are still contained by their downward sloping trendline.
Neither the IEFs nor the TLTs showed any meaningful downward move yesterday. Instead, prices were more or less unchanged.
So -- in short -- we're still waiting for the firm confirmation from either the stock or bond markets -- or both in tandem.
However, let me add these two charts above into the mix. Brazil (top chart) broke higher today and closed above resistance. The Chinese market (bottom chart) has clearly moved above resistance and is right below the 200 day EMA. Typically, these charts lead the US markets higher, so these are good signs.
Let's start with the Treasury curve, as there are some very important developments here. Notice that the IEFs and TLTs have both broken support. Neither have moved convincingly lower, but the break is clearly there. Both prices are right above the 50 day EMA and we see a declining MACD pattern that has been occurring for over two months. The IEIs are right at support as well. The treasury market has been taking money out of the equity markets as the safety bid has been very strong. The above charts indicates that might be ending now.
Also note the QQQs (top chart) broke out of their trading range on Friday, moving above the 65.5 level. The SPYs almost made it, but fell back at the end of trading. The charts above are not out of the woods yet; ideally we'd like to have a follow through day on decent volume.
The dollar has been trading in a range for the last tow months, moving between 22.4 and 23.1. While the dollar was the previous benefactor of the safety trade in the market, that honor is now bestowed on the Australian dollar and, to a lesser degree, the Canadian dollar.