Saturday, June 9, 2012
Weekly Indicators: ending spring weakly positive edition
- by New Deal democrat
There was little in the way of monthly data this past week. The bright spot was the ISM services index which rose slightly. Productivity fell, which is actually a positive for jobs and wages. Wholesale inventories were up. Factory orders decreased, continuing their streak, along with durable goods, of being the most negative of the leading indicators.
Let me repeat a few points about this column. First, it is not designed to be predictive but rather an up-to-the-moment report on the economy by use of high frequency weekly indicators. Second, while there is some randomness in each week's data, if there is a turning point in the economy, it should show up in these indicators first before it shows up in monthly indicators.
Housing reports were mixed:
The Mortgage Bankers' Association reported that the seasonally adjusted Purchase Index was reported to have fallen "slightly" from one week before, and was down -3.0% YoY. The Refinance Index rose 2.0% with lower mortgage rates. Despite the declines of the last few weeks, this index continues to be in the upper part of its 2 year generally flat range.
The Federal Reserve Bank's weekly H8 report of real estate loans, which turned positive at the end of March after having been negative for 4 years, fell less than -0.1% w/w, and the YoY comparison declined -0.1% to +0.9%. On a seasonally adjusted basis, these bottomed in September and remain up +1.3%.
YoY weekly median asking house prices from 54 metropolitan areas at Housing Tracker were up + 2.3% from a year ago. Median asking prices, at $236,118, have now been higher YoY for over 6 months, and are higher than at any point last year, when the highest month featured median asking prices of $231,233. To repeat my point from last week, either this index had to turn or the Case-Shiller repeat sales index had to turn. This index has been steadily higher, but the Case-Shiller index on a seasonally adjusted basis has now turned up for two months in a row. As I anticipated, the Housing Tracker index led the other indexes. Barring the appearance of the long-a'coming foreclosure tsunami, the bottom in prices is here.
Employment related indicators were also mixed:
The Department of Labor reported that Initial jobless claims fell 6,000 to 377,000 last week. The four week average rose 3,250 to 377,750. This may be a seasonal adjustment issue or something more ominous may be going on.
The Daily Treasury Statement for the first 5 days of June showed $39.4B vs. $38.3B for the first 5 days of June 2011. For the last 20 reporting days, $132.5B was collected vs. $117.8B a year ago, an increase of $15.5 B, or +12.5%. This is a more positive YoY comparison that has been usual in the last several months.
The American Staffing Association Index fell by one to 93. This is in keeping with prior years for the week including Memorial Day. It remains equal to 2007 and is several points below its all time record from 2006 for this week of the year.
Same Store Sales continue to be solidly positive.
The ICSC reported that same store sales for the week ending May 26 rise +0.4%w/w, and were up +2.8% YoY. Johnson Redbook reported a 3.1% YoY gain. Shoppertrak reported a gain of 3.2% YoY. The 14 day average of Gallup daily consumer spending remained positive again this week at $73 vs. $71 in the equivalent period last year.
Money supply was mixed again:
M1 fell -0.3% last week, and also fell -0.7% month over month. Its YoY level decreased to +15.4%, so Real M1 is up 13.1%. YoY. M2 was flat for the week, but rose +0.4% month over month. Its YoY advance fell slightly to +9.4%, so Real M2 increased to +7.1%. Real money supply indicators continue to be strong positives on a YoY basis, although they have had a far more subdued advance since September of last year.
Bond prices rose slightly and credit spreads continued to blow out:
Weekly BAA commercial bond rates fell .08% to 5.01%. Yields on 10 year treasury bonds fell .15% to 1.61%. The credit spread between the two increased further to 3.40%, a 52 week maximum. The trend of strongly falling bond yields means that fear of deflation is strong.
Rail traffic also was mixed again.
The American Association of Railroads report showed that total traffic for the week was flat YoY. Non-intermodal traffic was negative again, with 9 of 20 groups participating, down by -8400 cars, or -3.1% YoY. Excluding coal, this traffic was up +5,100 cars. Intermodal traffic was up 8,300 carloads, or +4.1%.
The graphs by Railfax are once again very instructive, showing cyclical traffic up about 5% YoY, while it is the non-cyclical baseline traffic which is off more than 10% YoY.
The energy choke collar continues to disengage:
Gasoline prices fell for the seventh straight week, down another .06 to $3.61. Oil was generally flat this week and ended at $84.10. Oil has only been less expensive for about 1 in the last 12 months, and are now well below the point where they can be expected to exert a constricting influence on the economy. Since gasoline prices follow with a lag, we can expect gasoline to fall to that point as well. The 4 week average of Gasoline usage, at 8796 M gallons vs. 9167 M a year ago, was off -4.0%. For the week, 8648 M gallons were used vs. 9143 M a year ago, for a decline of -5.4%. This is not enough to cause me concern as June last year was one of the few months that did not have a YoY decline.
Turning now to high frequency indicators for the global economy:
The TED spread fell 0.1 to 0.39, near the bottom of its recent 4 month range. This index remains slightly below its 2010 peak. The one month LIBOR rose 0.001 to 0.241. It is well below its 12 month peak set 3 months ago, remains below its 2010 peak, and has returned to its typical background reading of the last 3 years. It remains interesting that neither of these two measures of fear have budged even slightly with the Europanic of the last month.
The Baltic Dry Index fell for the third week in a row, down from 904 to 877. It remains 207 points above its February 52 week low of 670. The Harpex Shipping Index fell 2 points from 459 to 457 last week, the first time it has not risen in close to 4 months.
Finally, the JoC ECRI industrial commodities index fell again this week, down from 117.74 to 116.25. This is at a 52 week low. This indicator appears to have more value as a measure of the global economy as a whole than the US economy.
The only domestic data which look poor YoY are gasoline usage and rail traffic, and while the decline is real, it still appears to have everything to do with energy efficiency. Initial claims, purchase mortgages, and real estate loans, which are seasonally adjusted, have retreated but not so much so as to set off alarm bells yet. Consumer spending continues to hold up like a champ, fueled no doubt in part by the continuing refinancing boom. Those areas faring the poorest are all related to European and/or Asian weakness: credit spreads, shipping rates, and commodity prices.
In short, US data, while mixed in this week's report, continues to look weakly positive, and certainly better than it was last August and September. This coming week in monthly data will give us retail sales, producer and consumer prices, and industrial production, which will generally complete the picture for May. Watch to see if real sales and production are weakly positive or not.
Friday, June 8, 2012
Weekend Weimar, Beagle and Pit Bull
It's that time of the week. NDD will be here tomorrow with the indicators. I'll be back on Monday. Until then ....


Yes, It's Uncertainty, But Not From the US ....
From the Washington Post:
And given the expectation that many European countries are in for long bouts of austerity, executives do not envision a rebound.
Last month, John Chambers, chief executive of networking
giant Cisco, said that not only was business in Europe getting worse, but customers around the world were also holding back on purchases while they wait to see what happens on the continent.
“I think people are in this uncertain environment and when they’re uncertain, unfortunately, you don’t spend,” he said. “Even the financial institutions outside of Europe are really focused on getting the profitability back in line. . . . So clearly, they’re keeping their powder dry.
The Beige Book
The opening summation of the page book follows. Overall, the report is fair. Consumers are still spending, manufacturing is doing well, the auto industry is good and real estate has rebounded. However, we're still not as "escape velocity"
Begin the report:
Reports from the twelve Federal Reserve Districts suggest overall economic activity expanded at a moderate pace during the reporting period from early April to late May. Activity in the New York, Cleveland, Atlanta, Chicago, Kansas City, Dallas, and San Francisco Districts was characterized as growing at a moderate pace, while the Richmond, St. Louis, and Minneapolis Districts noted modest growth. Boston reported steady growth, and the Philadelphia District indicated that the pace of expansion had slowed slightly since the previous Beige Book.
Manufacturing continued to expand in most Districts. Consumer spending was unchanged or up modestly. New vehicle sales remained strong and inventories of some popular models were tight. Sales of used automobiles held steady. Travel and tourism expanded, boosted by both the business and leisure segments. Demand for nonfinancial services was generally stable to slightly higher since the last report, and several Districts noted strong growth in information technology services. Conditions in residential and commercial real estate improved. Construction picked up in many areas of the country. Lenders in most Districts noted an improvement in loan demand and credit conditions. Agricultural conditions generally improved, and spring planting was well ahead of its normal pace in most reporting Districts. Energy production and exploration continued to expand, except for coal producers who noted a slight slowing in activity.
Wage pressures overall were modest. Hiring was steady or increased slightly, and contacts in a number of Districts reported difficulties in finding qualified workers, particularly those with specialized skills. Price inflation remained modest across Districts, and overall cost pressures eased as the price of energy inputs declined. Economic outlooks remain positive, but contacts were slightly more guarded in their optimism.
Manufacturing
Manufacturing continued to expand, and most Districts reported gains in production or new orders. The only exceptions were from the Philadelphia, Richmond and St. Louis Districts, where factory activity was mixed or had softened slightly. Demand appeared to be the strongest in auto and steel manufacturing. Reports from the Cleveland, Atlanta, Chicago, and St. Louis Districts noted vibrant activity for auto manufacturers, and an auto maker in the Atlanta District reported plans to add a third shift to keep up with increased global demand. Steel manufacturing remained robust, with contacts in the Chicago District reporting the highest capacity utilization rates since the end of the recession and firms in the St. Louis and Minneapolis Districts noting plans to upgrade or expand operations. Producers of semiconductors and high-tech equipment saw continued growth in orders in the Dallas and San Francisco Districts. Aircraft and parts makers noted further increases in orders according to reports from Boston, Richmond, and San Francisco, while the Dallas District reported steady demand. Demand for agricultural and construction equipment remained strong according to the Chicago District report, and industrial machinery manufacturers in the Philadelphia District noted gains. Food producers in the Philadelphia and Dallas Districts noted solid demand for their products, and pharmaceutical manufacturers in the San Francisco District reported robust activity. Activity at refineries and petrochemical manufacturing facilities expanded further. Demand for construction-related products improved in the Dallas District, and orders for lumber and wood products increased in most reporting Districts.
Hiring at manufacturing firms was mixed, but manufacturers in some Districts reported difficulty finding qualified workers such as welders. Capital spending plans in most reporting Districts were positive. Ongoing capital investments and plans for future capacity expansions were reported by various manufacturers in the Chicago, St. Louis, Minneapolis, and Kansas City Districts. Firms in the Cleveland District noted spending on capital outlays was on track, while producers in the Philadelphia District reported a decline in future spending plans since the previous report. Manufacturers' outlooks were positive in the Philadelphia, Cleveland, Chicago, and Kansas City Districts; however, contacts in a number of Districts were concerned that a slowdown in Europe and domestic political uncertainty may affect future business conditions.
Consumer Spending and Tourism
Retail spending was flat to modestly positive in nearly all Districts. Firms in the Richmond, Chicago, and Minneapolis Districts noted sales increased at a more modest pace than in the previous report, as unseasonably warm weather and an earlier Easter holiday had shifted sales into the previous reporting period. By contrast, warm spring weather continued to boost traffic and sales for retailers in the Philadelphia and Cleveland Districts. Sales of household goods increased in the Boston and Kansas City Districts, and gains in apparel sales were reported by the Boston and Dallas Districts. Sales of big ticket items declined in the Richmond and Chicago Districts, and there were a few reports of high fuel prices affecting consumer spending and sentiment. Inventories were generally at desired levels and were being managed carefully. Outlooks were optimistic, and retailers in several Districts expect modest sales growth in the near term. In particular, contacts in the Kansas City District expect stronger sales growth in coming months, while some retailers in the Chicago District plan to add inventories in expectation of higher back-to-school sales compared with last year.
Automobile sales generally remained strong, although the pace of growth moderated in a few Districts. Sales of used vehicles held steady, and a slight decline in prices was reported. Inventories of popular vehicles were tight. Outlooks were positive and contacts across several Districts expect steady growth in sales in coming months.
Reports from most Districts pointed to continued strength in travel and tourism, bolstered by both the business and leisure segments. Favorable spring weather spurred tourism in the Minneapolis and Kansas City Districts. Time-share rentals were strong in the Richmond District, and foreign visitors boosted activity in Florida as well as at theme parks in the Philadelphia District. Restaurants and food service contacts in the Richmond, Kansas City, and San Francisco Districts noted increased sales. Ticket prices and attendance at Broadway theaters strengthened in the New York District, boosting revenues to well above year-ago levels. Business travel picked up in the Boston, New York, and Atlanta Districts, and convention bookings were strong according to the Atlanta District. Hotel bookings were strong in the Boston and New York Districts, and solid gains or high levels of occupancy and room rental rates were noted by hotel contacts in most reporting Districts. Atlanta's report noted that hospitality-related projects were underway in several areas of the District.
Nonfinancial Services
Demand for nonfinancial services was generally stable to slightly stronger since the previous report. Several Districts noted some growth in information technology services, including Boston, Richmond, Kansas City, Dallas, and San Francisco. Solid demand for healthcare services was also noted by some Districts.
A few Districts said that activity expanded for professional and business services, such as accounting, engineering, advertising, and legal services. The Boston District noted some renewed activity in the financial sector, although engineering and accounting demand remained weak. The Richmond District said architectural engineering firms reported stronger revenues, and Minneapolis noted strength in engineering near oil producing areas, in part due to planned future construction. Responding firms in the Dallas District noted strength in legal services and accounting.
Advertising sales picked up in the Philadelphia and San Francisco Districts, and air travel improved in the Dallas and San Francisco Districts. Freight transportation volumes moved higher in Cleveland, and railroad contacts in the Atlanta District noted continued growth. However, Kansas City's report noted flat activity in transportation, and the Dallas report noted mixed results from shipping firms.
Real Estate and Construction
Activity in residential real estate markets improved in most Districts since the previous report. Several Districts noted consistent indications of recovery in the single-family housing market, although the recovery was characterized as fragile. The apartment market continued to improve, and multifamily construction increased in several Districts.
Home sales were above year-ago levels in most areas of the country and several Districts noted sales had improved since the previous report, although some noted that the pace was well below the historical average. In particular, the New York, Cleveland, and Richmond Districts noted a pickup in the pace of distressed sales. Residential brokers and some builders in the Philadelphia, Atlanta, and Dallas Districts said home sales were exceeding expectations. Contacts in the Richmond District said homes were being snapped up as investors become more confident in the housing recovery, and the Atlanta report noted stronger sales to cash buyers and investors in Florida. Chicago said more sales had multiple offers. Apartment rental markets improved in the New York, Atlanta, and Dallas Districts. One contact from the New York District noted rising apartment rents have made buying more attractive, contributing to a slight uptick in sales.
Most Districts reported that home inventories decreased. Overall, home prices remained unchanged in many Districts, although reports were mixed. There were a few reports that sellers were lowering asking prices, leading to downward pressure on housing prices.
New home construction increased in a number of Districts, including Cleveland, Atlanta, Chicago, St. Louis, Minneapolis, and San Francisco. Contacts in the Philadelphia District said demand for new home construction eased slightly. Builders in Kansas City noted housing starts were down, but they expected an increase in the next three months. The Boston, Atlanta, and Chicago Districts reported an increase in multifamily construction, and the Minneapolis District noted numerous multifamily projects were in the pipeline.
Commercial real estate conditions improved in most Districts, and there were some reports that commercial construction picked up. Commercial leasing remained steady or increased in most Districts including Philadelphia, Richmond, Atlanta, Chicago, St. Louis, Minneapolis, Kansas City, Dallas, and San Francisco. The New York, Dallas, and San Francisco Districts noted growth in the technology sector was prompting the absorption of commercial space. Energy activity was helping boost demand for space in the Richmond and Dallas Districts. Boston's relatively strong commercial market continued to generate robust investor interest, although commercial property sales in the New York District remained slow.
Build-to-suit construction was noted by the Boston and Philadelphia Districts. The New York District reported new office development projects in the pipeline, and St. Louis' report noted a pickup in speculative industrial projects. The Richmond District said expansion in manufacturing led to a pickup in construction. Reports from the Cleveland and Chicago Districts suggested an increase in hotels and higher education projects, and a New York contact noted that interest in luxury hotel development increased. Outlooks were positive overall, although there were a few reports of increased uncertainty from still unknown U.S. fiscal changes and Europe's debt situation.
Banking and Finance
Most Districts that commented on lending noted steady or slightly stronger loan demand. Small and medium-sized banks in the New York District reported the most broad-based increase in loan demand since the mid-1990s. Several bankers in the Richmond District said the volume of small business loan applications was markedly higher. Drivers of business loan demand included energy, healthcare, and commercial real estate. Several Districts noted increased demand for capital spending loans.
Reports on mortgage lending generally indicated slow improvement. The New York District noted stronger mortgage lending, although growth in refinancing eased. The Cleveland District indicated strong mortgage demand and a shift from home refinancing to new purchases. The Richmond District cited continued improvement in mortgage demand, although refinancing still dominated much of the mortgage lending. The Atlanta District said that more applicants had ample cash for down payments or enough equity in their homes to meet refinancing requirements. Demand for commercial real estate loans was generally reported to be stronger.
A number of Districts, including Cleveland, Atlanta, Chicago, Dallas, and San Francisco, said loan pricing remained quite competitive. New York District respondents noted a decrease in spreads of loan rates over the cost of funds, particularly for commercial mortgages. Lending standards were relatively unchanged to slightly easier across Districts and loan types. Bankers reporting on deposit growth indicated that deposits were steady or continued to increase. Credit quality remained solid, and there were several reports of improved loan quality. Most District banks said loan delinquencies continued to decline.
Agriculture and Natural Resources
Agricultural conditions generally improved since the previous report. Rainfall provided much needed moisture in several parts of the Richmond, Minneapolis, and Dallas Districts. Spring planting and crop emergence was well ahead of the normal pace in most reporting Districts, and corn producers in the Chicago District were hopeful that this promising start may result in a record harvest. Producers in the St. Louis, Kansas City, and Dallas Districts noted that the winter wheat crop was in fair-to-good condition. Farm incomes rose further in the Minneapolis and Kansas City Districts, and the San Francisco District reported further sales growth for most crop and livestock products. Producers in the Chicago and San Francisco Districts expressed concern that persistent dry conditions may undermine crop production. Although prices of most agricultural commodities declined, hog and cattle prices rose since the previous report.
Energy activity remained robust, with drilling expanding further in the Cleveland, Atlanta, Minneapolis, Kansas City, and Dallas Districts. Atlanta's report noted that increased investment in transportation infrastructure was needed to accommodate the recent rise in domestic and Canadian energy production. Exploration and production continued to shift away from dry-gas to wet-gas or oil-directed drilling in the Dallas and San Francisco Districts in part due to low natural gas prices. Firms in the Kansas City District said they would like to expand payrolls but reported difficulty finding engineers and experienced field workers. Iron-ore and rock mining continued to expand at a strong pace according to the Minneapolis District report. In contrast, demand for coal slowed in the Cleveland and St. Louis Districts, and contacts noted that production was below year-ago levels. Limestone quarries in the Minneapolis District continued to report sluggish demand.
Employment, Wages, and Prices
Hiring was steady or showed a modest increase. Reports of hiring were most prevalent in the manufacturing, construction, information technology, and professional services sectors. Staffing firms in the Cleveland and Dallas Districts noted a pickup in orders, and contacts in the Boston and Philadelphia Districts reported steady growth in orders. Demand for temporary workers rose in the Richmond District, and several employers in the Minneapolis District noted a tightening labor market. New York's report indicated that demand for staffing services was mixed, but manufacturers and other business contacts expect hiring to pick up in coming months. Atlanta's report pointed to positive employment growth in the District. Hiring remained limited in the Chicago District, and modest employment increases were noted in the San Francisco District report. There were widespread reports that firms continued to face difficulty finding highly trained or skilled workers--especially in information technology, engineering, and manufacturing fields--and manufacturers in the Chicago District said they were easing job requirements or using interns to fill open positions. Overall upward wage pressures continued to be fairly modest. There were reports of slight wage increases for skilled workers in the Boston, Cleveland, Minneapolis, Dallas and San Francisco. Contacts in the Philadelphia and Chicago Districts noted increases in healthcare costs.
Price inflation was modest across most areas of the country. Reports from several Districts, including New York, Philadelphia, Richmond, Chicago, Minneapolis, and Dallas indicated selling prices were stable or had softened somewhat since the previous report. Some Districts, including Philadelphia, Chicago, Minneapolis, Dallas, and San Francisco noted cost pressures eased as the price of energy inputs fell. However, Atlanta's report noted some firms had implemented price increases tied to previous increases in energy costs, and firms in the Kansas City District noted higher input and final goods prices.
Morning Market Analysis


The Italian, Spanish and French markets are in the middle of a quick, technical rebound. The best point of all charts is the declining BB width, telling us that volatility is dropping. The Italian market is in slightly better condition, as prices have moved completely through a downward sloping trend line, while Spanish and French prices broke their respective trend, but then fell back. At this point, there is no reason to think of these as other than technical rallies from oversold positions.

Gold is in an interesting position right now. The bulls will still be arguing that runaway government spending requires a hedge -- as does the EU situation. However, inflation is contained and dropping across the globe. As such, I don't see the need for gold to move one way or the other right now.

The junk bond market has sold off a bit over the last month or so, with prices falling to the 38.2% Fib level from the end of 2011-early May rally. However, note the declining momentum picture over the last 5 months, and weaker CMF reading as signs that this move lower was forecast.


However, the corporate market is still doing well. However, there are a few chinks in the armor. Notice the overall declining MACD in the short and intermediate sectors, and the fact that prices have moved through the trend line on the intermediate curve. The EMA picture is starting to deteriorate on the short and intermediate curves as well.
Thursday, June 7, 2012
Bonddad Linkfest
- Spain holds trump card in negotiations (NYT)
- Europe's woes give Democrats new line of attack (NYT)
- CBO defends stimulus (WaPo)
- US crop progress (AgWeb)
- 7 reasons farmland values are high (AgWeb)
- Liveblog of ECB conference (Money Supply)
- BOE keeps rates at .5% (BOE)
- China cuts rate 25 BP (FT)
- Beige Book (FRB)
- Depressing (Free Exchange)
The Mess That is The UK Economy
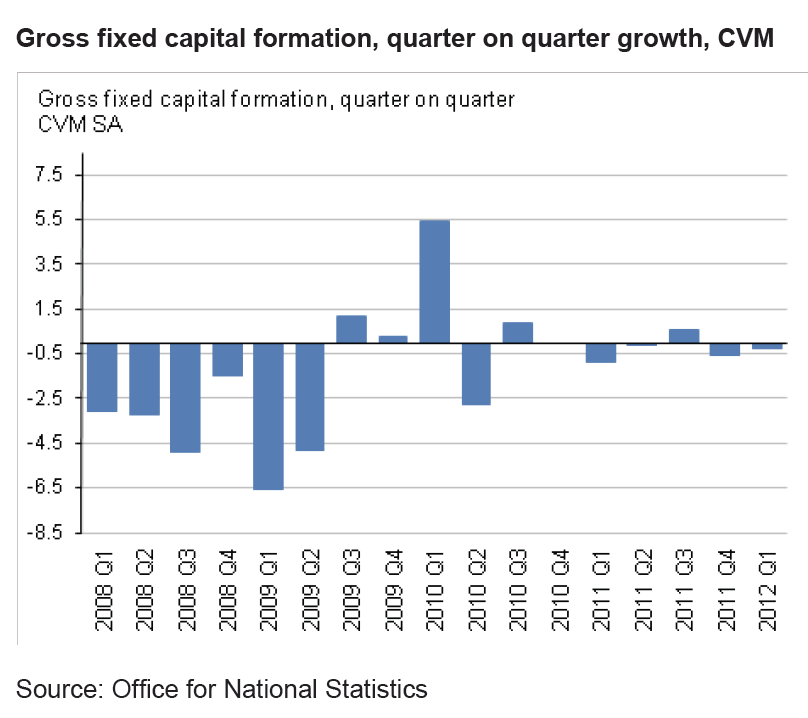
The following charts are from the latest UK GDP report. I bring them up for several reasons. First, the UK economy is not in good shape. While the state is not catastrophic, it is not booming either. Also consider that this is the economy which authorities thought could withstand some type of austerity program, telling us that the people making policy in the UK just aren't that bright.

The above chart, to me, is the most troubling. Manufacturing growth has clearly been declining since the 2Q10 and is now negative.

Household spending still has a recessionary profile.

And we see an overall dearth of capital investment.
For me, the key issue is the final household consumption expenditures, which tell us that households just aren't spending. In a developed economy, that is literally the kiss of death. While US consumers aren't spending as much as they used to, they are still contributing to economic growth.

The above chart, to me, is the most troubling. Manufacturing growth has clearly been declining since the 2Q10 and is now negative.

Household spending still has a recessionary profile.
And we see an overall dearth of capital investment.
For me, the key issue is the final household consumption expenditures, which tell us that households just aren't spending. In a developed economy, that is literally the kiss of death. While US consumers aren't spending as much as they used to, they are still contributing to economic growth.
Krugman v. the Austerians
Almost sounds like a Godzilla movie, doesn't it?
Anyway -- here's the video:
Anyway -- here's the video:
Here's how the BBC described the footage at this link:
Jeremy Paxman is joined by Nobel Prize winning economist Paul Krugman, venture capitalist Jon Moulton and Conservative MP Andrea Leadsom to discuss whether austerity is always the best method for resolving a country's national debt problem.
0 - 1:26: Krugman notes that experience over the last few years indicates that austerity does not work. It’s been tried
in the UK, Greece, Ireland and to a certain extent the US. It does not work. In addition, austerity makes the long-term
fiscal situation worse by lowering growth, thereby lowering GDP and increasing
the debt/GDP ratio at the macro level.
1:26 – 2:05: Ms. Leadsom makes two arguments. More spending
doesn’t solve the problem; it’s really simple math. In addition, we should be implementing a far
more aggressive austerity program to sharpen the hit and get it over with.
Bonddad: The “simple math” argument works just as strongly
when you consider the GDP equation (C+I+X+G), doesn’t it? So why not increase spending, especially when consumption and investment is down? In addition, the “we’re not doing it properly
argument,” is pure garbage. The MP
sidesteps the simple fact that austerity hasn’t worked as advertised. Instead, she says, “let’s try it again, but
do it more aggressively. There is no
data to back-up this claim; it’s pure faith.
2:05-3:05: Krugman notes that when everyone is trying to cut spending all at once, you cut yourself
into a depression – an observation noted by Irving Fisher in the 1930s. There is a circular nature of the economy;
your spending is my income and my spending is your income. When everyone is slashing spending at the
same time, income drops at the macro level.
3:10-3:52: Mr. Molton makes two arguments. First, that the public sector is too big
(according to him, The UK government sector accounts for 50% of GDP) and that
there is a moral argument about passing on too much debt.
3:52-4:30: Krugman responds that the real moral crime is
there are no jobs for college graduates right now; they’re graduating with
degrees and they have no jobs available.
In the scheme of things, a high unemployment rate is in fact more
“immoral” than too much debt.
Bonddad’s note: something that is missed here is that in
borrowing to build the economy, you create jobs and growth. Eventually, there is enough growth from the
public sector to hand off growth to the private sector. This growth increases GDP, which eventually
lowers the debt/GDP ratio. In addition, properly implemented Keynesian policy leads to a hand-off from government to the private sector.
4:40-4:50: Mr. Molton and Ms. Leadsom respond that growth
will return as people leave the public sector and join the private sector. Ms. Leadsom also argues that the government
should be lowering taxes and, in general, creating an environment for entrepreneurs to start businesses etc..
4:50-5:42: Krugman responds that most people won’t start
businesses.
Bonddad’ note: this is a very important point, and one that
is often not fully developed. Inherent
in the idea of supply-side economics is that the government should create an
entrepreneur friendly business climate.
First, being an entrepreneur myself, I couldn’t agree more. But, just as importantly, most people aren’t
entrepreneurs; most people work for other people. Consideration must be made for the far larger number of people who aren't entrepreneurs.
In addition, Krugman notes that the real agenda of the
conservatives is to cut the size of government; that their agenda isn’t fiscal,
but political.
5:40-6:24: Cross talk between Molton and Krugman regarding
the size of the state and economic growth.
Mr. Molton references a study (I believe by “Alfonso”) which
demonstrates that larger public sectors slow growth. Krugman responds that this is not true and
uses Sweden as an example.
6:24-7:20: Ms. Leadsom argues that taking money from the
private sector for the public sector is not the way to create jobs; that, in
fact, either public sector expands or the private sector expands.
Krugman states she is missing the point. The real problem is that the economy is in a
depression; there are a vast number of resources that are not being used. At this time, the government and the private
sector are not competing for resources.
As such, government spending isn’t going to crowd out investment.
7:20-8:20: Ms. Leadsom argues that lowering taxes and
deregulation are in fact the most effective way to stimulate the economy.
Krugman notes that in survey after survey, businesses are
saying lack of demand is the real problem.
8:20-8:40: Mr. Molton argues there have been some austerity
success stories. Krugman responds that
those worked because interest rates were high and could be lowered or that the country
could devalue their currency, which no one can do right now.
And that’s the end.
Bonddad’s commentary:
In response to the conservative argument, I wish I had
written this, but it’s from Mark Dow (I used this earlier this week, but frankly, it's just too good to not use again):
Basically, supply-side policies work best when there is pent-up private sector demand. By lowering the cost of investment, you can unleash a self-reinforcing cycle. The bigger the pent-up demand, the bigger the payoff to an improvement in expectations. Without that pent-up demand, resources freed from supply-side measures and austerity get saved, not spent, and no self-reinforcing cycle is triggered.
The world of 1980 had tons of pent-up demand and gale-force tailwinds. Inflation and interest rates were coming down from high levels, household leverage was very, very low, financial innovation non-existent, consumption had been deferred, and demography was coiled as the baby boomers were just coming on line. On the government side, unions were powerful, price and wage controls were a reality, and tax rates were high. This was the ideal set up for supply side reforms.Fast-forward to post-2008. Whatever the opposite of pent-up demand is, that’s what we have. Inflation and interest rates are already low, household leverage is a major burden, consumption was pulled forward during the boom, and demography is no longer our friend. Plus, we have globalization acting like a supply shock to our labor pool, holding down wages. In short, the tailwinds are now headwinds. On the government side, unions are far less powerful today, there are no price and wage controls, and tax rates are low. It seems next to impossible to make the case that supply-side policies can have anywhere near the effect today that they had in the 80s.
The conservative representatives were really politicians and
not economists. As such, they were at a
disadvantage when answering and dealing with economic questions. I think a fairer debate would have been to
have someone like John Taylor represent the conservative view – someone who is
more versed in economics and could have responded in appropriate terms. Put another way, this debate was between two politicians and an economist.
At no point did any of the conservatives talk about unemployment. There was no mention of how many people are out of work and something should be done about that. They obviously felt no need to to get people to work in any way. And that, in and of itself, is a big problem.
Morning Market Analysis

Yesterday's chart was a great chart. It opens with a gap higher with a follow-through rally. Prices consolidated for most of the day, but the rallied higher on a nice volume spike.

The 60 minute chart shows that prices consolidated between 130 and 134 between May 21 and May 31. At the beginning of June, prices formed a"V" shaped reversal pattern. Yesterday, prices made a strong advance. The next best thing prices could do would be to advance through the 134 level.

On the daily chart, notice that prices have printed two strong bars in a row, and are now through the 200 day EMA.
The above charts give hove that a relief rally may be in order. However, we're a long way before talking about a return to bullish sentiment.


Both the financial and technology ETF have moved through resistance. While the financials are still below their 200 day EMA, the technology sector has moved through the 200 day EMA.

The weekly oil chart shows that prices have been in a strong downtrend for the last 6 weeks, moving from the 105 area to the current 84.81 level -- a drop of 19%. Even if prices bottom here, there's been a fair amount of technical damage to the chart: prices are below all the EMAs, the shorter EMAs are moving lower, the MACD has given a sell signal and volatility is increasing. In addition, consider this chart of total US inventories:

We have a ton of supply on hand.
Wednesday, June 6, 2012
For God Sakes -- the Markets Are ASKING US TO BORROW!!!!!!!
Lawrence Summers:
Right now, the markets are essentially asking the US government to borrow. And yet, we're still discussing the idea ofausterity.....
The question is not whether the current policy path is acceptable. The question is what should be done? To come up with a viable solution, consider the remarkable level of interest rates in much of the industrialised economies. The US government can borrow in nominal terms at about 0.5 per cent for five years, 1.5 per cent for 10 years and 2.5 per cent for 30 years. Rates are considerably lower in Germany and still lower in Japan.
..........................
These low rates even on long maturities mean that markets are offering the opportunity to lock in low long-term borrowing costs. In the US, for example, the government could commit to borrowing five-year money in five years at a nominal cost of about 2.5 per cent and at a real cost very close to zero. What does all this say about macroeconomic policy? Many in both the US and Europe are arguing for further quantitative easing to bring down longer-term interest rates. This may be appropriate given that there is a much greater danger from policy underreacting to current economic weakness than from it overreacting.
However, one has to wonder how much investment businesses are unwilling to undertake at extraordinarily low interest rates that they would be willing to with rates reduced by yet another 25 or 50 basis points. It is also worth querying the quality of projects that businesses judge unprofitable at a -60 basis point real interest rate but choose to undertake at a still more negative real interest rate. There is also the question of whether extremely low safe real interest rates promote bubbles of various kinds.
Right now, the markets are essentially asking the US government to borrow. And yet, we're still discussing the idea ofausterity.....
Will Housing Save Us?
Several weeks ago, NDD and Barry Ritholtz of the Big Picture had a friendly debate about whether or not the housing market has bottomed. NDD noted that housing is actually affordable by most measures, pent-up demand for housing exists, and that the shadow inventory story hasn't materialized (there are links to Barry's pieces in NDDs pieces; I recommend you read them as well).
First, put me in the camp that we're at minimum very close to a bottom in housing. This is based on the following:
1.) New home inventory is near multi-decade lows.
2.) New home sales have been at the same (albeit very low) level for several years.
3.) Existing home sales have stabilized
4.) Existing home inventories are now at far more realistic levels (excess inventory has been worked off).
5.) While real house prices are still dropping, we're far closer to a historical bottom than the top. In addition, nominal prices are fairly stable (same link).
Ultimately, for me it comes down to inventory; new home inventories are incredibly low, existing home inventory is far more realistic and the "shadow inventory" story -- which has been hanging our or heads for the last three years -- has never materialized. Diminishing or steady supply = stable cost and, ultimately a more stable market.
All that being said, I want to propose a fairly radical hypothesis: new home sales and construction might wind up saving us. Let me explain why.
First, consider this graph of the months of available supply of new homes from Calculated Risk:

We're at multi-decade lows. Put another way, most of the time we see more inventory in the market place, rather than less. That means we're short inventory; a sudden increase in demand would lead to the market being caught flat-footed.

In addition, the current level of building permits is at a historical low. And, the last four times building permits were at this level, they were followed by a sharp increase. Also note that three of the last four times we were at these level, we were in in a recession. Finally, three of the last four times housing permits were at this level a multi-year expansion followed.
Let's place this data in historical perspective:

 The top chart shows that single family starts are still very low by historical standards -- that the building permit increase is largely the result of non-family units. However, the bottom graph shows that from a percent of GDP perspective, the single family market is actually at very low levels as a percent of GDP -- in fact, it's very much out of synch with its historical trend. Put another way, we've got nowhere to go but up.

The previous observation is highlighted more accurately in this graph, which shows construction spending is at very low historical levels.
So -- why should people do this now? That is, why should people jump into the new home market? Simple: interest rates are never going to be this low again in our lifetime. Consider this chart:

The 10-year treasury yield has been declining since 1980 -- a 30 year trend. On Friday, it closed at 1.45%. Simply put, it can't get much lower. And with the world's population becoming more middle class, we'll see continued constraint in resource usage -- meaning more inflationary pressures, meaning interest rates have nowhere to go but up.
Perhaps most importantly, I'm not the only person thinking this way; home builders have become more confident over the lats 6 months:

To sum up, we over-invested in housing in the 2000-2010 time period. Now the pendulum has swung the other way to a period of under-investment, largely to work off the massive inventory overhang. But, we're getting close to the end of the cycle, which means a bump in demand could lead to the market being caught off-guard. In addition, there is the interest rate story; the cost of borrowing to buy a home isn't going to get much cheaper.
The main element missing here is the stimulus that gets things moving; and the answer to that is jobs.
First, put me in the camp that we're at minimum very close to a bottom in housing. This is based on the following:
1.) New home inventory is near multi-decade lows.
2.) New home sales have been at the same (albeit very low) level for several years.
3.) Existing home sales have stabilized
4.) Existing home inventories are now at far more realistic levels (excess inventory has been worked off).
5.) While real house prices are still dropping, we're far closer to a historical bottom than the top. In addition, nominal prices are fairly stable (same link).
Ultimately, for me it comes down to inventory; new home inventories are incredibly low, existing home inventory is far more realistic and the "shadow inventory" story -- which has been hanging our or heads for the last three years -- has never materialized. Diminishing or steady supply = stable cost and, ultimately a more stable market.
All that being said, I want to propose a fairly radical hypothesis: new home sales and construction might wind up saving us. Let me explain why.
First, consider this graph of the months of available supply of new homes from Calculated Risk:

We're at multi-decade lows. Put another way, most of the time we see more inventory in the market place, rather than less. That means we're short inventory; a sudden increase in demand would lead to the market being caught flat-footed.

In addition, the current level of building permits is at a historical low. And, the last four times building permits were at this level, they were followed by a sharp increase. Also note that three of the last four times we were at these level, we were in in a recession. Finally, three of the last four times housing permits were at this level a multi-year expansion followed.
Let's place this data in historical perspective:


The previous observation is highlighted more accurately in this graph, which shows construction spending is at very low historical levels.
So -- why should people do this now? That is, why should people jump into the new home market? Simple: interest rates are never going to be this low again in our lifetime. Consider this chart:

The 10-year treasury yield has been declining since 1980 -- a 30 year trend. On Friday, it closed at 1.45%. Simply put, it can't get much lower. And with the world's population becoming more middle class, we'll see continued constraint in resource usage -- meaning more inflationary pressures, meaning interest rates have nowhere to go but up.
Perhaps most importantly, I'm not the only person thinking this way; home builders have become more confident over the lats 6 months:

To sum up, we over-invested in housing in the 2000-2010 time period. Now the pendulum has swung the other way to a period of under-investment, largely to work off the massive inventory overhang. But, we're getting close to the end of the cycle, which means a bump in demand could lead to the market being caught off-guard. In addition, there is the interest rate story; the cost of borrowing to buy a home isn't going to get much cheaper.
The main element missing here is the stimulus that gets things moving; and the answer to that is jobs.
Morning Market Analysis

The dollar continues to rally. After breaking through resistance around the 22.4 level, it has continued higher to the 23 handle before consolidating. The MACD is close to giving a sell signal and the RSI is pegged, telling us that, at minimum, a consolidation may be in order.

The yen has also continued the rally it started in mid-March, essentially catching a safety bid as the EU mess took center state. Prices have now moved through the 38.2% Fib level of the February to mid-March sell-off. Prices are now above the 200 day EMA as well, although the MACD and RSI are getting a bit long in the tooth.

The euro chart is the mirror image of the dollar chart. After moving through support at the 129.5-130 level, prices have continued lower to their current 123.85 price. A move below the 122 level would be an indication that prices have more room to move lower.
Key to both the dollar and euro charts is the downward shift in the Bollinger Band widths, telling us that volatility is starting drop a bit. Given the distance we've seen prices move, consolidation at the current level wouldn't be a surprise.

Utilities are consolidating above the mid-March highs, just below the end of the year price spike. But the underlying technicals are weakening; the CMF is negative and the MACD is meandering.


Both the consumer staples sector and the health care sector are dropping. Both have declining momentum and negative volume inflow. The big gap down for both three days ago is also troubling; these sectors should be a bit safer from these types of gyrations.
Tuesday, June 5, 2012
Bonddad Linkfest
- What worries Romney Backers (Politico)
- Election year bind for the Fed (the Hill)
- G7 holding emergency meeting to discuss Europe (FT)
- TD securities Australian inflation gauge flat (TD Securities)
- EU producer price steady (eurostat)
- US factory orders decrease .6% (Census)
- Australia lowers rates by 25BP (RBA)
- Record rice crop will lower prices (BB)
- The benign neglect of the long-term unemployed (Fiscal Times/Thoma)
Professor Taylor's Completely Misguided Reagan Comparison
Once again, professor Taylor is talking with admiration and love of the Reagan recovery. In his latest blog post, he writes about a memo to Reagan written a few weeks before he took office. However, Professor Taylor's statement that Reagan's policies -- if implemented -- would solve our current economic situation is completely misinformed. First, as I've pointed out, we're in the middle of a debt deflation recovery. The policies to extract ourselves from this problem are far different than the Reagan slump.
More to the point, here is the central problem with Taylor's analysis, beautifully written:


More to the point, here is the central problem with Taylor's analysis, beautifully written:
The world of 1980 had tons of pent-up demand and
gale-force tailwinds. Inflation and interest rates were coming down from
high levels, household leverage was very, very low, financial
innovation non-existent, consumption had been deferred, and demography
was coiled as the baby boomers were just coming on line. On the
government side, unions were powerful, price and wage controls were a
reality, and tax rates were high. This was the ideal set up for supply
side reforms.
Fast-forward to post-2008. Whatever the opposite of
pent-up demand is, that’s what we have. Inflation and interest rates
are already low, household leverage is a major burden, consumption was
pulled forward during the boom, and demography is no longer our friend.
Plus, we have globalization acting like a supply shock to our labor
pool, holding down wages. In short, the tailwinds are now headwinds. On
the government side, unions are far less powerful today, there are no
price and wage controls, and tax rates are low. It seems next to
impossible to make the case that supply-side policies can have anywhere
near the effect today that they had in the 80s.
As the title to the above referenced article states, "Reagan's dead, you're old, get over it." The continual pining for the age of Reagan has become a fetish on the right (which typically conveniently forgets his extensive fiscal recklessness), as they long for a presidency and time that is over and with which we have nothing in common economically.
Consider the following points:

Taxes are already low; cutting them more from this level will have little to no impact on economic activity -- but will blow a bigger hole in the deficit. Compare especially the the personal tax rate in late 1970s to today; in the 1970s it was around 9% of GDP and climbing; now it's around 7%.. And corporate rates -- which have always been low, are now near the lowest they've been in the last 40 years.
And then there is the fact that marginal rates are far lower today (39.6% v. 70% when Reagan took office). And while the US corporate tax rate is 35%, there are more holes than Swiss Cheese in the corporate code allowing corporations to pay little to no tax in most situations (and that's assuming the company uses the corporate structure rather than a pass through structure: most don't).
And then there is the fact that marginal rates are far lower today (39.6% v. 70% when Reagan took office). And while the US corporate tax rate is 35%, there are more holes than Swiss Cheese in the corporate code allowing corporations to pay little to no tax in most situations (and that's assuming the company uses the corporate structure rather than a pass through structure: most don't).
And then there is this:

Under Reagan, interest rates were at their highest level in nearly 50 years. When you lower rates from 17.5% to a 8%, you're going to simulate growth. Now, we're at the lowest level we can get.
The political right has been preaching the same policy prescription for the last 40 years: lower regulation and lower taxes. While that solution did help to contribute to Reagan's economic success, an excessive amount of both got us into the current situation: a complete laissez-faire attitude toward regulation led to a financial sector making all sorts of stupid loans that started the housing bubble and the continual cutting of taxes without the requisite cutting in spending started the budget mess (Bush tax cuts + Iraq war + Medicare Part D == massive budget hole).
Our current economic problem can best be defined as a liquidity trap:
The Liquidity trap is a Keynesian idea. When expected returns from investments in securities or real plant and equipment are low, investment falls, a recession begins, and cash holdings in banks rise. People and businesses then continue to hold cash because they expect spending and investment to be low. This is a self-fulfilling trap.Consider these charts:


We have a ton of money available to lend. But we're not lending it:

Banks aren't lending at nearly the rate they could be right now. That means interest rates will stay low (excess supply = lower cost).
Another reason we have the increased savings is people aren't spending at anywhere near the same pace:


Transactions are moving at a glacial pace -- and getting slower not faster.
Professor Taylor is a darling of the WSJ editorial page. In saying that, we know before he even writes a word what he's going to say and advocate for. But the available data completely contradicts his statements and beliefs regarding the economy. As I've previously written, the "policy uncertainty" argument doesn't hold up to even a surface evaluation, let alone an in-depth analysis. And I have yet to see his reasoning on why this isn't a debt deflation bubble, especially when all the pieces of the theory clearly line up.
To re-state the title of Mr. Dow's article: Reagan is dead. He and Clinton had the benefit of rising the wave of baby boomers as they hit their peak earning years. All either had to do was get out of the way -- which both did. However, we're dealing with a completely different population and economic situation now for which the standard supply side ideas offer no new ideas -- and, in fact, would greatly exacerbate the current fiscal situation.
Morning Market Analysis
Let's start by looking at a longer view of three large markets: Germany, China and Brazil:

Earlier this year, the German market rallied to just shy of the 61.8% Fib level, but has since fallen. It found initial support at the 200 week EMA level, but has now moved lower, while breaking a trend line. The underlying technicals are weak -- we see a declining MACD, CMF and RSI. The nest logical price target in at the 17-17.25 level.

Interestingly enough, the Chinese market did not make new highs earlier this year, but came just shy of making that mark. Like the German market, Chinese shares have been falling for the better par of this year. Whats most concerning about this chart is the logical price target is about 30 -- about 7.6% below current levels. That would make this years from (from about 40.5) a total of 25% -- bear market territory.

The Brazilian market has fallen the farthest -- from 70 to 50.49, or a drop of almost 28%. In addition, the underlying technicals are all bearish -- dropping momentum and volume and increasing volatility.
Each of these three markets are important in their respective geographic areas. As such, the drops above do not bode well for the future. More importantly, the further downside room on the German and Chinese markets is very concerning.
In addition, consider the following yield curves:

The Australian yield curve is slightly inverted form the 3m to 2 year area. The highest yield we see is 3.2%.

The German yield curve is very low -- the 20-30 year curve is slightly inverted, with the 30 year at 1.70%.

The Japanese yield curve is also very low, with the 30 year showing a rate of just below 1.8%.

The UK yield curve is slightly inverted at the short end of he curve, with a 30 year yield of 2.86%.
Put another way -- there's a tremendous amount of nervousness on the part of traders right now. Money is flowing out of the stock markets and into bonds, with the safest bond markets (Germany and Japan) at incredibly expensive levels.
Subscribe to:
Posts (Atom)