It's that time of the week. Stop thinking about the markets. To that end ...


There is a growing risk that deflation will be seen as the gravest threat to the US economy by the end of the year, warns Nick Beecroft, senior FX consultant at Saxo Bank.He notes that the minutes of last month’s Federal Reserve policy meeting show the US central bank becoming increasingly concerned with the fall in inflation.
And the latest consumer price data will have reinforced these worries, he says. “As the year progresses, the output gap – exemplified by the still chronically weak labour market and very low levels of capacity utilisation – will lead inflation inexorably towards zero.”
Here are some important excerpts from the latest FOMC Minutes:
Meanwhile, a sizable increase in energy prices pushed up headline consumer price inflation in recent months; in contrast, core consumer price inflation was quite low......
Although rising energy prices continued to boost overall consumer price inflation, consumer prices excluding food and energy were soft, as a wide variety of goods and services exhibited persistently low inflation or outright price declines. On a 12-month change basis, core personal consumption expenditures (PCE) price inflation slowed in January 2010 compared with a year earlier, as a marked and fairly widespread deceleration in market-based core PCE prices was partly offset by an acceleration in nonmarket prices. Survey expectations for near-term inflation were unchanged over the intermeeting period; median longer-term inflation expectations edged down to near the lower end of the narrow range that prevailed over the previous few years. With regard to labor costs, the revised data on wages and salaries showed that last year's deceleration in hourly compensation was even sharper than was evident at the January meeting.
.....
Headline consumer price inflation picked up around the world over the past two months, principally reflecting increases in food and energy prices. Excluding food and energy, consumer prices were generally more subdued.
.....
Reflecting these developments, inflation compensation--the difference between nominal yields and TIPS yields for a given term to maturity--declined over the period, a move that was supported by the somewhat weaker-than-expected economic data and the publication of lower-than-expected readings on consumer prices.
.....
Recent data on consumer prices and unit labor costs led the staff to revise down slightly its projection for core PCE price inflation for 2010 and 2011; as before, core inflation was projected to be quite subdued at rates below last year's pace. Although increased oil prices had boosted overall inflation over recent months, the staff anticipated that consumer prices for energy would increase more slowly going forward, consistent with quotes on oil futures contracts. Consequently, total PCE price inflation was projected to run a little above core inflation this year and then edge down to the same rate as core inflation in 2011.
.....
Participants saw recent inflation readings as suggesting a slightly greater deceleration in consumer prices than had been expected. In light of stable longer-term inflation expectations and the likely continuation of substantial resource slack, they generally anticipated that inflation would be subdued for some time.
.....
Participants referred to a wide array of evidence as indicating that underlying inflation trends remained subdued. The latest readings on core inflation--which exclude the relatively volatile prices of food and energy--were generally lower than they had anticipated, and with petroleum prices having leveled out, headline inflation was likely to come down to a rate close to that of core inflation over coming months. While the ongoing decline in the implicit rental cost for owner-occupied housing was weighing on core inflation, a number of participants observed that the moderation in price changes was widespread across many categories of spending. This moderation was evident in the appreciable slowing
of inflation measures such as trimmed means and medians, which exclude the most extreme price movements in each period.In discussing the inflation outlook, participants took note of signs that inflation expectations were reasonably well anchored, and most agreed that substantial resource slack was continuing to restrain cost pressures. Measures of gains in nominal compensation had slowed, and sharp increases in productivity had pushed down producers' unit labor costs. Anecdotal information indicated that planned wage increases were small or nonexistent and suggested that large margins of underutilized capital and labor and a highly competitive pricing environment were exerting considerable downward pressure on price adjustments. Survey readings and financial market data pointed to a modest decline in longer-term inflation expectations over recent months. While all participants anticipated that inflation would be subdued over the near term, a few noted that the risks to inflation expectations and the medium-term inflation outlook might be tilted to the upside in light of the large fiscal deficits and the extraordinarily accommodative stance of monetary policy.
This is something we'll be talking about more next week after looking deeper into the data.


The Empire State Manufacturing Survey indicates that conditions for New York State manufacturers improved at a rapid pace in April. The general business conditions index rose 9 points, to 31.9. The new orders and shipments indexes advanced as well, and the inventories index climbed to a record high. The prices paid index moved up 12 points to 41.8, its highest level in considerably more than a year, while the prices received index held fairly steady at a level just above zero. Employment indexes rose to high levels, suggesting that employment levels are continuing to improve. Future indexes conveyed an ongoing sense of optimism about the six-month outlook.

Claims continue to pile up due to special administrative factors. Initial jobless claims jumped for a second week, up 24,000 in the April 10 week to 484,000. The four-week average is up 7,500 to 457,750 but is still a bit below the month-ago level. Continuing claims for the April 3 week rose 73,000 to 4.639 million, a level that is also the four-week average. Here too, the four-week average is a bit below the month-ago comparison.
The Labor Department attributes the rise in claims not to economic factors but to continuing administrative snags as offices catch up with claims during the shortened Easter week and, in California, for the Cesar Chavez holiday. The department is warning the next report may be affected by quarter-end reclassifications for emergency compensation, but that the chances for downward revisions are greater than for upward revisions.
Given all the noise in the data, expectations are likely to hold for a big gain in April payrolls, at least for now. Equities and commodities fell but only briefly in initial reaction to today's report.

Overall economic activity increased somewhat since the last report across all Federal Reserve Districts except St. Louis, which reported "softened" economic conditions. Districts generally reported increases in retail sales and vehicle sales. Tourism spending was up in a number of Districts. Reports on the services sector were generally mixed. Manufacturing activity increased in all Districts except St. Louis, and new orders were up. Many Districts reported increased activity in housing markets from low levels. Commercial real estate market activity remained very weak in most Districts. Activity in the banking and finance sector was mixed in a number of Districts, as loan volumes and credit quality decreased. Agricultural conditions were mixed as well, with positive conditions reported in Districts from the central and western parts of the country, while negative conditions were reported in the mid and southern Atlantic Districts. Mining and energy production and exploration increased for metals, oil and wind.
While labor markets generally remained weak, some hiring activity was evident, particularly for temporary staff. Wage pressures were characterized as minimal or contained. Retail prices generally remained level, but some input prices increased.
Let's look at more detail:
District reports indicated that consumer spending increased during the reporting period. New York and Cleveland reported that recent sales strengthened, while sales rebounded in Richmond and Kansas City. Slight sales gains were reported in Philadelphia. Retail sales in San Francisco continued to improve, but remained somewhat sluggish on net. In St. Louis several new establishments opened, particularly in the food industry. Several Districts described consumers as somewhat more confident. Businesses were cautiously optimistic regarding future sales: Cleveland, Atlanta, Kansas City and Dallas noted that retailers expect sales to improve during the upcoming months. Sales of home furnishings and electronic goods increased in a number of Districts, while seasonal apparel sales were up in New York, Philadelphia and Kansas City. New York and Minneapolis noted that shopping by Canadians was strong at businesses near the border. Atlanta reported that retailers continued to keep inventory levels lower than normal, and retailers in New York reported that inventories are in very good shape.
Let's look at the data:
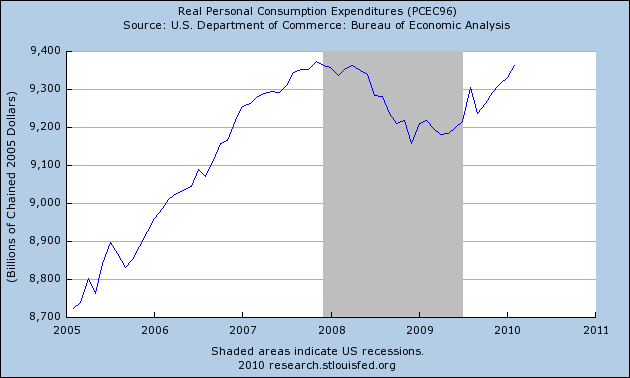
Real PCEs have been increasing since the first quarter of 2009.
Service expenditures -- which account for over 60% of consumer expenditures -- never really decreased but instead were put into a holding pattern. However, they have now started to increase.
Increases in non-durable expenses started to increase right near the end of the first half of 2009.

Durable goods expenditures are still stuck in a rut. However, these comprise the smallest part of PCEs.
Business services were mixed, with some signs of economic recovery. Boston and Minneapolis reported increased activity. Richmond and Dallas were mixed, while San Francisco said demand remained lackluster. St. Louis reported that the sector continued to decline. Advertising and consulting firms in Boston said demand is up substantially from the first quarter of 2009, while an advertising contact in Richmond and professional media services firms in San Francisco characterized sales as flat at low levels. Dallas reported sluggish demand for nontax-related accounting and legal services. Law firms in Minneapolis specializing in debt collections and bankruptcy saw strong demand, while a Richmond property manager noted a large number of repossessions.
Here is a chart of the ISM services index:

Notice this bottomed out in late 2008 and has been rising since. The number is now above 50 indicating expansion.
Manufacturing activity increased since the last report across most of the country, with all Districts other than St. Louis reporting increases in orders, shipments, or production. Boston, Cleveland, Chicago, Dallas and San Francisco reported positive results in metals and fabrication. Cleveland, Richmond, Atlanta and Chicago reported increased auto or auto component production. Boston, Richmond, Dallas, and San Francisco saw increased production in electronic, computers or high-technology goods. Chicago and Minneapolis saw increased production of energy-related products. However, for construction-related goods, Chicago and Dallas reported mixed conditions, Boston reported flat activity and St. Louis reported decreases. Overall, St. Louis saw more plant closures than plant openings.
Here is a chart of the overall ISM manufacturing index:

This number has rebounded sharply since the end of 2008.


Overall industrial production bottomed in mid-2009 and has been rising since, as has

Bank lending activity was mixed by category in most Districts. Atlanta, St. Louis and Kansas City saw weaker loan demand across categories, while activity in San Francisco was flat at low levels and Dallas said that demand appears to be stabilizing. Demand for consumer credit decreased in New York and increased slightly in Philadelphia. Most banks in Cleveland reported weak consumer loan demand, although a few contacts saw a slight increase due to seasonal factors. Business and industrial loan volumes decreased in Philadelphia, Cleveland and Chicago and were flat in New York. San Francisco noted continued modest gains in venture capital funding.
Consumers are engaged in a massive drop in credit. We've seen consumer credit drop for the majority of last year. In addition, consider this chart of total bank credit outstanding:

Notice this figure has been dropping since before the end of 2009. In addition, consider these charts from the latest senior loan officer survey:


All point to weaker loan demand as a factor for the decrease in loans.
Residential real estate activity increased, albeit from low levels, in most Districts, with the exceptions of St. Louis, where it was mixed, and San Francisco, where it was flat. Contacts in Philadelphia, Cleveland and Kansas City expressed concern about whether sales would continue to grow after the expiration of the first-time home buyer tax credit. New York, Kansas City, Dallas and San Francisco noted sluggish sales for high-end homes. Home prices were stable across most Districts, but decreased in parts of the New York and Atlanta Districts. Residential construction activity increased slightly in New York, Atlanta, St. Louis, Minneapolis and Dallas, but remained weak in Cleveland, Chicago and San Francisco.
Let's look at the new and existing home market with charts from Calculated Risk.

Existing home sales have fallen back to levels seen in 2008 and 2009.

While the inventory is still decreasing, it did spike up last month. In addition,
In addition, the months of supply available at the current sales pace moved higher last month.


The new home sales chart tells us that sales are still very low, absolute inventory is back to more "normal" levels, but the months available at the current sales pace is again increasing, which is not a good sign.
As for construction spending (also from Calculated Risk):

We're still at low levels.
A complete review of the latest employment numbers is here.
Short version: things are looking pretty good right now.


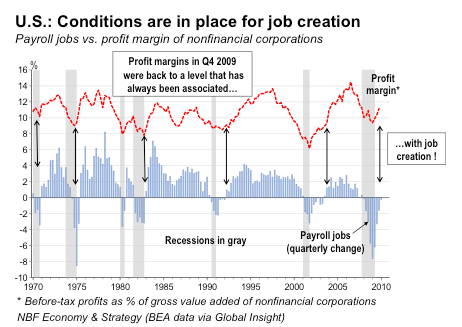
 and that graph is a few months old.
Much of the rally of the past year has been in anticipation of a profit recovery. And now that recovery is actually coming in a bit better than bulls expected, which is why they are able to elbow bears so effectively. ISI Group now figures that corporate profits will clock in at +38.8% for the first quarter (year over year) of 2010, then +42.4% in the second quarter, +36.8% in the third quarter and then +30% in the fourth quarter (against harder comparisons). That would put profits in 2010 up a record 36.1% overall.
Business Index of Small Business Optimism lost 1.2 points in March, falling to 86.8. The persistence of index readings below 90 is unprecedented in survey history.
“The March reading is very low and headed in the wrong direction,” said Bill Dunkelberg, NFIB chief economist. “Something isn’t sitting well with small business owners. Poor sales and uncertainty continue to overwhelm any other good news about the economy.”
[Robert] Rubin [, ...] who's been almost exactly 180 degrees wrong on the major economic issues of his time thinking these days [ ], in an essay published by Newsweek late last year, [ ] worried about too much spending on job-creation, opposed forcing the riskiest derivative contracts onto public exchanges, resisted an accounting reform that would require financial institutions to assess their assets based on actual market prices rather than just making things up, and warned against what he calls impractical proposals to break up "too big to fail" banks. His most pressing concern was the federal deficit. All in all: A decidedly Wall Street rather than Main Street agenda.
Money creation [warning:pdf] might be of gain for the receiver of the new money, who receives it without a productive effort. The newly created money spreads through the economy as the first receiver spends it on particular goods, bidding up prices and, thus, raising the revenue of the sellers of those goods. But it is at the expense of those who are the ones that are the last to receive part of the new money, while at the same time have to pay higher prices. And then there is the risk of bank failures, a risk everybody will be affected by. Hence, we see that the bankers, the merchants and the government are the first to benefit by the creation of fiduciary media. But this also means that it is at the expense of other parts of the population. And at a crisis, everybody is likely to lose.
As a result of loose monetary policy, which aims to "protect" the financial system, financial institutions always receive the new money first. Obviously this gives rise to an expansion of activities of the earlier receivers of money. An early receiver of money can afford, so to speak, to become more of a risk taker and undertake various risky activities.
In reality however, the new money leads to an exchange of nothing for something. It leads to the enrichment of the earlier receivers and to the impoverishment of the late or nonreceivers of the new money. Money and credit out of thin air leads to a redistribution of real wealth.
The gifting of Wall Street and its counterparties directly with $Trillions creates the exact same first/early receiver vs. late/non-receiver problem as with the gifting of fog-the-mirror credit to purchase houses: this is real money, and it is going into concentrated hands. Those parties can -- indeed are intended to -- use that cash in an effort to prop up the value of assets they hold. That money will only slowly spread into the general economy (remember how we were told in September [2008] that we needed to rescue Wall Street so that they would continue to lend to Main Street businesses?), by way of certain business, and lastly of all, if at all, to the average American household -- who will be faced with even more inflated values for assets compared with their households' purchasing power.
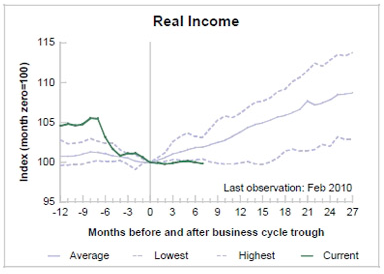
In summary and conclusion, even if the various Wall Street bailouts succeed, they will continue and amplify the trend that has been in place for 30 years: creating yet a wider gulf between the wealthy and the financially connected, and the average American and his/her family, rewarding the former while punishing the latter, who already during this last business cycle, for the first time since the Great Depression, saw their real wealth and income decline.
Americans heartened by an improving job market flocked to shopping malls and auto showrooms in March, raising the odds of a durable economic recovery.Retail sales increased 1.6 percent last month, more than anticipated and the biggest gain in four months, according to figures from the Commerce Department issued today in Washington. Another report showed consumer prices rose 0.1 percent.
Stocks climbed for a fifth day after the reports signaled the expansion is broadening without stoking inflation, and results at JPMorgan Chase & Co. and Intel Corp. beat estimates. Federal Reserve Chairman Ben S. Bernanke told lawmakers today the world’s largest economy still faces “significant restraints,” indicating policy makers will keep interest rates low in coming months.
“What we’re seeing now is the consumer take part in the recovery,” said Joseph LaVorgna, chief U.S. economist at Deutsche Bank Securities Inc. in New York. “The Fed’s not taking the punch bowl away quite yet,” because inflation is “very tame,” he said.
In testimony before the Joint Economic Committee of Congress, Bernanke said recent data indicated a “moderate economic recovery in coming quarters,” while weak construction and still-high unemployment remained impediments to faster growth.
The complete report is here. There are some really good numbers, such as
Auto sales up 6.7%
Furniture/home furnishings: +1.5%
Building materials up 3.1%
Clothing up 2.3%
The one bid negative was electronic/appliance stores which were down 1.3%.
But, this was a very good report.
The general opinion of the US consumer is that he will change his overall behavior from one of spending to one of savings and frugality. This in fact has already occurred to an extreme degree. There are several reasons for this. Unemployment is high and will remain at that level for the foreseeable future. When a person does not think he will be able to find a job if he losses his current job than he will spend less today. In addition, household debt is at very high levels and the consumer -- who has been paying down debt and shunning new debt -- will continue to do so. This will lead to an increase in savings which will lower consumption.
However, there has been an underlying assumption to this argument that the US consumer will stop buying to such a degree as to be a non-factor in GDP. In other words, the consumer will move from a position of being a fundamental driver of US growth to having little to no impact. That is a radical view -- and one I believe to be incorrect for two reasons. First, from a practical side things wear out and need to be replaced. The US consumer cannot eliminate the need to replace things. In addition, as the consumer holds onto goods longer, other items need to be purchased -- replacement parts and the services to fix items. In addition, the economy will not always be in its current position; at some point the unemployment rate will return to manageable levels, salaries will increase and asset valuations will be stable. When this occurs the consumer will feel more confident and will be more willing to spend on goods and services. However, the old consumer -- the one who spent wildly on everything -- will not return.


Total inventories of merchant wholesalers, except manufacturers’ sales branches and offices, after adjustment for seasonal variations but not for price changes, were $393.5 billion at the end of February, up 0.6 percent (+/-0.5%) from the revised January level, but were down 7.4 percent (+/-1.1%) from a year ago. The January preliminary estimate was revised upward $1.0 billion or 0.3 percent. End-of-month inventories of durable goods were up 0.5 percent (+/-0.7%)* from last month, but were down 12.3 percent (+/-1.2%) from last February. Inventories of computer and computer peripheral equipment and software were up 2.5 percent from last month and inventories of lumber and other construction materials were up 2.0 percent. End-of-month inventories of nondurable goods increased 0.8 percent (+/-0.5%) from January and were up 0.7 percent (+/-1.8%)* compared to last February. Inventories of petroleum and petroleum products were up 3.1 percent from last month and inventories of chemicals and allied products were up 2.9 percent.


Any shortfall when companies report earnings this month, however, will be greeted far more harshly. After all, stocks have risen five straight weeks and are pushing 18-month highs. Stock buyers have seen data pointing to increasing orders, record productivity and an improving but still-hesitant pace of hiring, all of which should bode well for corporate profits. As a result, they've come to expect stellar first-quarter results. It is no coincidence the last two market pullbacks of 5% to 10% all occurred early in the earnings season. If the market hews to history, "market participants may sell the earnings news," notes Jeffrey Kleintop, chief market strategist at LPL Financial.


