Friday, February 5, 2010

Weekly Indicators: Blizzard edition

- by New Deal democrat

I'll post these over the weekend as an update here, so if you are in an area that will be experiencing the usual lousy winter weather, you can click on over and warm up with a few timely statistical items.
----------
UPDATE: Here are the weekly high-frequency indicators...

ICSC same store sales were reported up +0.1% from the week before, and only +0.4% YoY.

Similarly, Shoppertrak reported YoY "retail sales slipped 4.5 percent for the week ending January 30 while sales fell 6.5 percent versus the previous week ending January 23."

Oddly, although neither Shoppertrak nor the ICSC had sales in January at any time increasing YoY more than inflation -- and indeed generally less, for the month, the report was very positive:

While typically the lightest month of the year in terms of volume, and
no doubt in large part due to extremely easy comparisons to a year ago,
January's strong performance nonetheless suggests retailers might have
finally turned the corner. Preliminary results show total sales
increased 5.6% from a year ago to $26.6 billion for the 32 retailers we
track, while same-store sales were up 3.3%. This is the fifth straight
gain after 12 consecutive months of declines, and the best showing
since April 2008.


Auto sales for January were down from December (not unexpected given seasonality) at 10.8M annualized sales, but up more than 10% over a horrible January 2009.

Railfax reported cyclical traffic up ~15% from a year ago, an excellent sign of economic growth. Intermodal and total traffic loads were also up. Baseline traffic was still slightly behind last year.

The BLS reported initial jobless claims of 480,000 for the last week of January, in a tight range with the 472,000 and 479,000 of the two prior weeks. It is clear that the readings in the 430,000-440,000 range in late December and early January were due to over-generous seasonal adjustments. For an improved jobs outlook, we need this number to start to decline again in the next few weeks.

The E.I.A. reported gasoline usage slightly down YoY for second straight week. Gasoline cost $2.66/gallon, down slightly from recent highs. Oil ended the week at $71.89. As you recall, the energy prices are my main concern for job and economic growth later in the year, so this decline is a welcome sign, even if some of it is due to dollar gains due to European woes.

Finally, The Daily Treasury Statement for Feb. 4 showed $36.2B in withholding taxes paid vs. $44.9B 4 days into February last year. The month of January ended with $140.4B paid vs. $151.8B a year ago, a decrease of (-6.7%). I continue to believe that the seasonally adjusted low for this recession was probably in October, although it is disconcerting to see a YoY GDP gain, however slight, coupled with a decrease in withholding taxes for jobs this large.
-----------

Aside from watching to see if initial jobless claims start to decline again or not, this week will be most notable for January retail sales. Seasonal adjustments will most likely once again determine if the data reported above is actually "good" or "bad."

Thoughts on the Payrolls Number

Here are some random thoughts on the report:

1.) From the household data, we have some very good news. The civilian labor forice increased from 153,059 to 153,170. This forms the denominator of the unemployment percentage calculation. The number of unemployed decreased from 15,267 to 14,837. This means the unemployment rate decreased because the number of people unemployed actually decreased. This is a very good development.

2.) From the household data: the number of people employed increased from 137,792 to 138,333. While this number jumps around an awful lot, the size of the jump is also good news.

3.) not in the labor force dropped from 83,865 to 83,663. This means some people reentered the labor force -- also healthy.

4.) The unemployment rate decreased from 10% to 9.7% -- three tenths of a percent.

5.) While goods-producing industries saw an overall decline (-60,000) manufacturing saw an increase of 11,000.

6.) Since September 2009, temporary help services employment has risen by 247,000. This is a leading indicator.

7.) Average weekly hours increased from 33.8 to 33.9.

8.) Average hourly earnings increased from $22.41 to $22.45

January Payrolls Down 20,000

This is actually NDD's work. I had problems with the editing/compilation so I just cut and pasted. Bonddad

The bleeding of jobs during the Great Recession continued, albeit just barely in January, as the economy subtracted - 20,000 jobs.

:The relatively good news is that the unemployment rate declined from 10% to 9.7%.

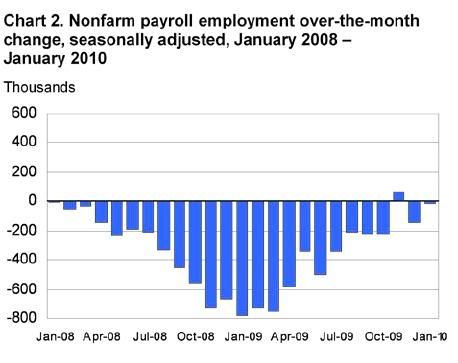
This month also saw revisions to the period from March 2008-2009 due to more accurate employer data being available, and some revisions to the months thereafter based on that template. The BLS has been widely criticized for its "birth/death" model which was adding hundreds of thousands of hypothetical jobs despite a tsunami of real layoffs, specifically quantified the 800,000 jobs losses it believed it missed a year ago, and also incorporated those changes into the last 9 months revisions. Here is the revised graph of payrolls for the last ---- months.


All in all, this was a vexing report, as the headline number remained negative, but virtually all of the internals improved. Details below.

As the financial blog Action Forex pointed out yesterday, "the range of probable outcomes is much larger in this [January] release than the other eleven releases of each year" in part because of the massive layoffs - nearly 3 million - which occur even in a typical January, as shown in this graph:


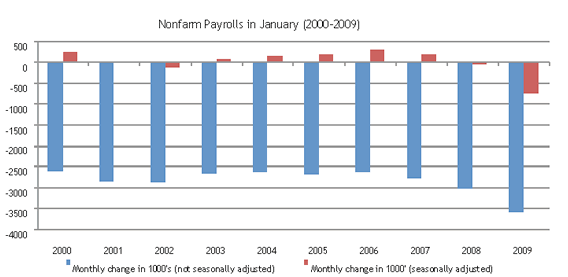
so today more resembles a best guess than the typical monthly data. As that blog said, here's what this morning's data boils down to:

- the level of employment will be shifted down by an estimated 824,000 for the period April 2008 to March 2009, but;
- revisions to months after March 2009 will also take place as the BLS tries to incorporate the new knowledge gained from the revision;
- the birth/death model will be revised, which impacts future releases;
- the Census Bureau hired (potentially large numbers of) temporary workers in January, which will inflate payrolls;
- seasonal factors will be revised, and the ramifications can be large in each direction;
- the revision only covers payrolls (from the Establishment Survey) and therefore does not affect the unemployment rate, which is derived from the Household Survey. Speaking of the unemployment rate we expect a slight increase to 10.1% from 10%.

The net result, after all of the new adjustments, was a gain/loss of - 20,000 jobs. November remained the first postive month for job growth, as it was revised up to +64,000 jobs. December, however, was revised down further to -150,000. (This is only the second negative revision in 10 months).

[Note: the graphs below do not include this morning's data, but are current through last month. I will substitute the January graphs as soon as they become available]

In January, the federal government added 33,000 jobs, including 9,000 tempo-
rary positions for Census 2010. Employment in state and local governments,
excluding education, continued to trend down.

I. After gaining jobs for two of the last three months, services (where 85% of Americans work) gained another +48,000 jobs.

Temporary jobs - typically added while employers wait to see if the economic improvement is more sustainable - went up for the 6th month in a row, by + 52,000. This is another excellent internal. Since September, +247,000 new temporary jobs have been added to the economy. Job gains were also reported in professional positions, including both health and education. Retail showed a substantial gain of +42,000.

Probably the most welcome internal number was that Manufacturing finally gained +11,000 jobs. Construction, in the epicenter of the economic downturn, continued to shed jobs at (- 75,000), mirroring the ongoing collapse of commercial real estate. The BLS report continues to track reasonably close to the private ADP survey, which reported a -22,000 loss in January, and out of line with the private ISM non-manufactuing survey, but finally did validate the gains showed in the ISM manufacturing employment index.

This is generally a continuation of the trend that began three months ago, when services jobs (red in the graph below) first showed growth in the payrolls report, but goods producing jobs (manufacturing + construction) (blue in the graph below)were still negative (a pattern seen at the end of past recessions).

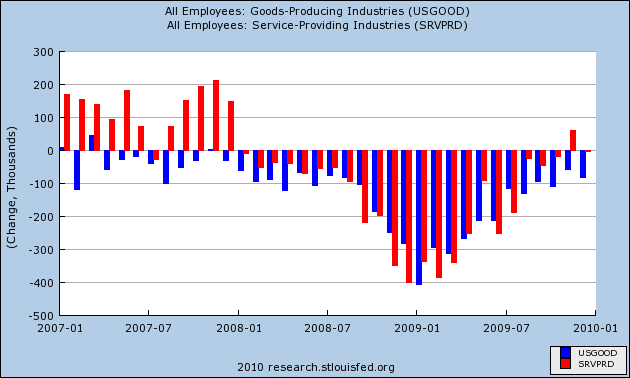
With this morning's revisions, +88,000 services jobs have been added in the last 3 months.

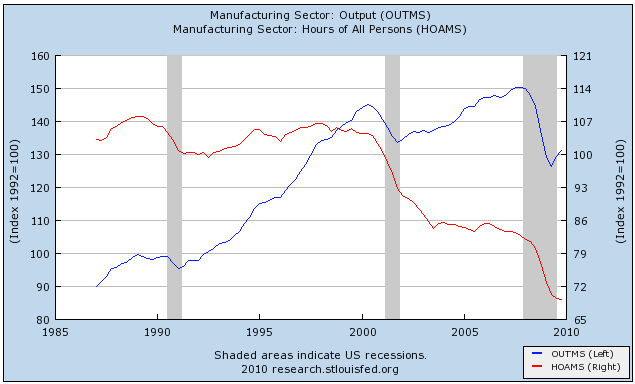
While workers have seen no real relief up until now in the jobs picture, manufacturing has indeed been having a classic, V-shaped recovery, as shown in this graph of ISM manufacturing, output, and blah blah:


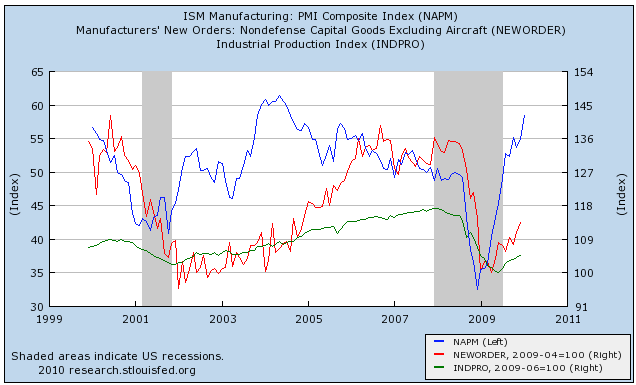
Yesterday we learned that manufacturers continue to make more and more product with fewer and fewer workers, but the decline in manufacturing hours worked slowed to a point that after the last two recessions suggested stabilization in the jobs market


As many of you already know, in fact there are two surveys -- the "establishment" survey which polls businesses, and received much criticism for its "birth/death" adjustment, which is corrected at least in part with today's revisions; and the "household" survey, conducted by the Census Bureau, which polls households, and does not have any such adjustment. The two do not measure the exact same thing (e.g., self-employment is not counted by the BLS), but track each other closely over time. Typically the household survey turns simultaneously with or one or two months ahead of the establishment survey.
The household survey (blue in the graph below vs. red for the establishment survey) turned positive two months ago, added + 541,000 jobs this month
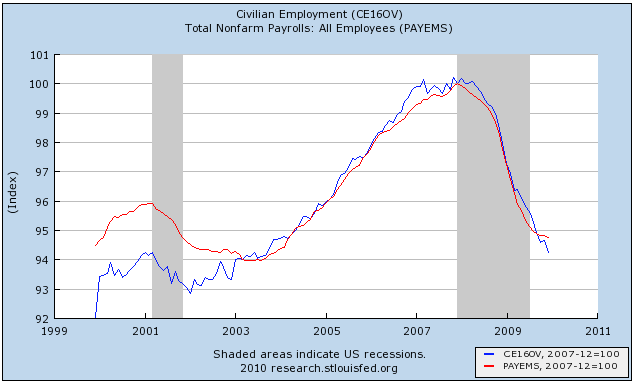
This means the household survey may have turned.

II. The revisions to past data

As we already knew, a lot of phantom jobs that the BLS was reporting due to its "birth/death" adjustment were going to disappear. Well, even more disappeared than we thought, 1.2 million vs. 840,000. Here is a revised chart of 2009 payrolls based on these revisions:

January........| 134,333 | 133,549 | -741 | -779 | -38
February.......| 133,652 | 132,823 | -681 | -726 | -45
March..........| 133,000 | 132,070 | -652 | -753 | -101
April..........| 132,481 | 131,488 | -519 | -582 | -63
May............| 132,178 | 131,141 | -303 | -347 | -44
June...........| 131,715 | 130,637 | -463 | -504 | -41
July...........| 131,411 | 130,293 | -304 | -344 | -40
August.........| 131,257 | 130,082 | -154 | -211 | -57
September......| 131,118 | 129,857 | -139 | -225 | -86
October........| 130,991 | 129,633 | -127 | -224 | -97
November.......| 130,995 | 129,697 | 4 | 64 | 60
December (p)...| 130,910 | 129,547 | -85 | -150 | -65

So, last year was considerably worse than originally reported. On the other hand, the net gains and losses in November and December evened out and the three month average for Nov. thru Jan. is - 65,000. This still suggests that job gains are close at hand and if anything, shows how dramatically the awful data from a year ago has ebbed.

II. The second big number reported this morning is the unemployment rate, which declined from 10.0% to 9.7%.

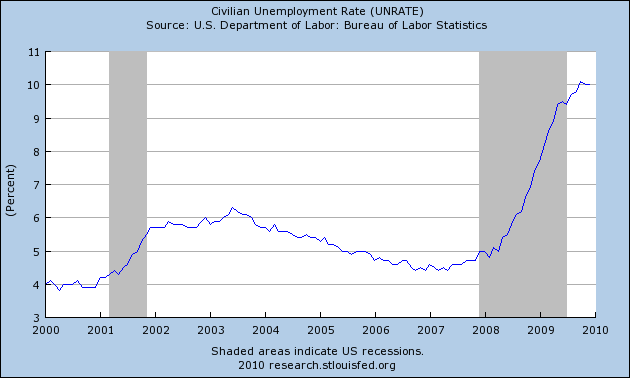
The alternative U6 number also declined significantly from 17.3% to 16.5%. This is in large part a reflection of the fact that discouraged workers continue to leave the economy. The labor participation rate rose for the first time in months, from 64.6% to 64.7%. Keep in mind that the unemployment rate is the last thing to turn positive in an economic recovery.

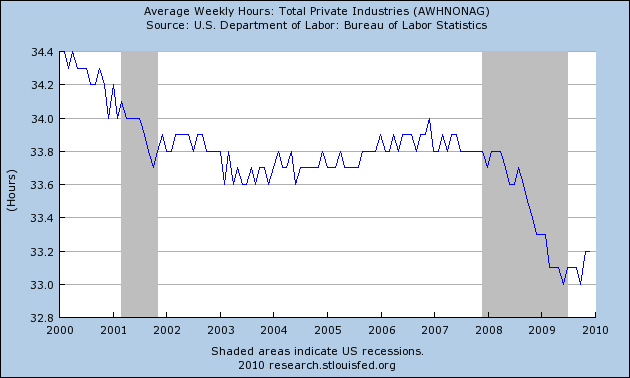
III. While the above are the headline numbers, there are other aspects of the report that are also very noteworthy. The aggregate number of hours worked in the economy bottomed in Ocotber, and improved +0.2% in January.


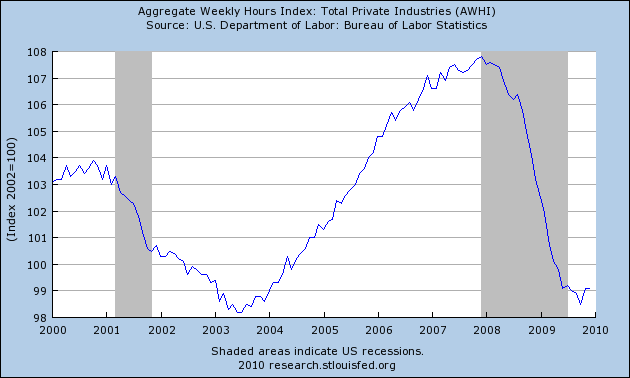
This means that in addition to hiring, hours of work are also increasing. It is also a measure relied on in part by the NBER to date the end of Recessions.

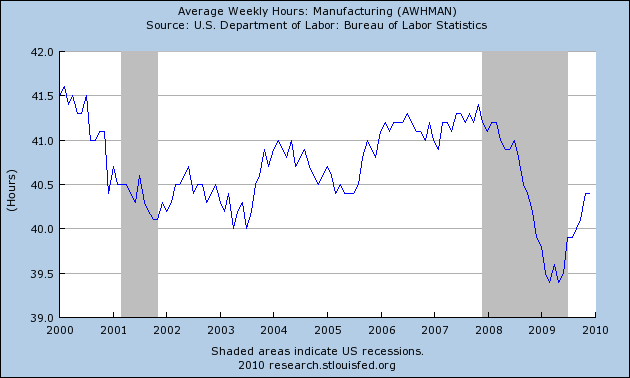
Another noteworthy item is the average number of hours worked in manufacturing. This is one of the 10 Leading Economic Indicators I refer to. It turned up back in the summer, and is an item I said to watch in terms of the possibility of a V-shaped recovery. It has risen substantially since then, ********from 40.4 hours in December to ************hours in January.:


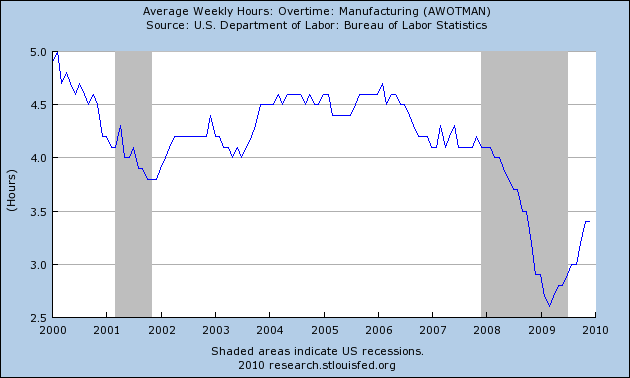
One more statistic thought to lead employment is hours worked in overtime, as typically employers will add to overtime in their workers before they hire new ones. This ******* went from 3.4 in November and December to ******hours in January:


The overall average workweek, which includes services and other jobs as well, increased from 33.2 hours to 33.3 hours.:


Hourly earnings also increased 0.3%:


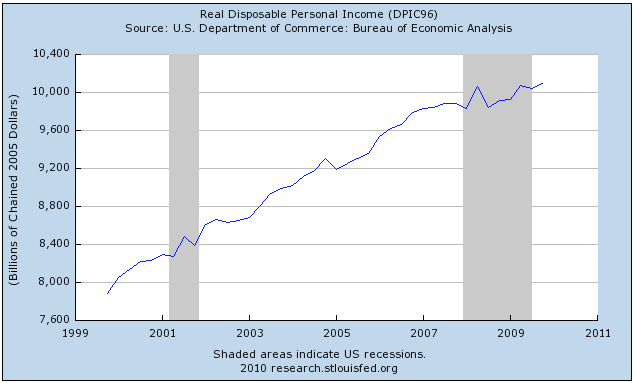
While employment gains have been a long time in coming, the other 3 "coincident indicators" typically used to determine the end of recessions - industrial production (green), real retail sales (red), and real income (blue) have all turned up -- the last two a little, the first one in a more V-shaped manner:


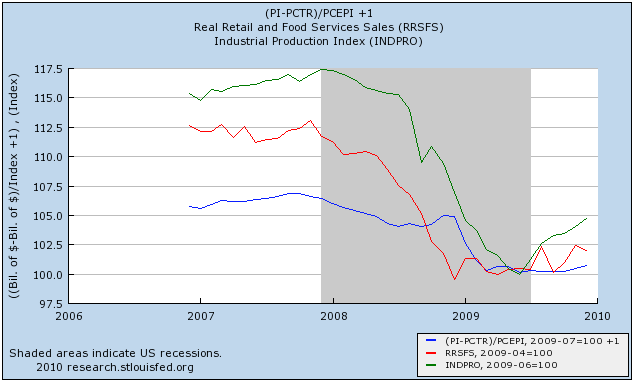
With employers still "hoarding" jobs, it is likely the NBER will continue to hold off making their call as to the end of the recession, although all of the numbers are certainly turning to the better. They will probably wait to see if the employment continues to improve.

Back in September, I said that}
"Based on my analysis above, November or December are when I believe that turning point will be reached, plus or minus one month in either direction. Let me be the first to acknowledge that this is not a scientific truth or certainty, but a best estimate based on a logical review of existing data with a long history that accommodates both traditional and "jobless" recoveries. Nevertheless, at least in terms of payroll growth, the analysis in these six installments cause me to predict that this will not be a "jobless recovery" for long.
That didn't happen, although we are within a whisker of so doing.

Forex Fridays


The dollar is in a classic up(A) down(B) up(C) pattern.

Prices consolidated in a pennant pattern (D).

The EMA/price picture is very positive. Prices are above all the EMAs; all the short EMAs are rising and the shorter EMAs are in a bullish orientation (the shorter are above the longer).


A.) Momentum is with the stock and

B.) Money is flowing into the UUP issue.

Thursday, February 4, 2010

Today's Market


First, note the market is in a down (A), up(B), down (C) pattern.

Prices have moved through support at line D.

Volume is higher (E), indicating people are leaving the market.

The EMA picture (F) is negative. All the EMAs are moving lower, the shorter EMAs are now below the longer EMAs and prices are below all the EMAs.

Bottom line: the market is looking technically worse.

Initial Unemployment Claims Increase 8,000

From Bloomberg:

Layoffs appear to have picked up through January judging by disappointing jobless data. Initial claims in the Jan. 30 week rose 8,000 to 480,00 with the prior week revised 2,000 higher to 472,000. Importantly, the Labor Department said there are no special factors in the latest week. The four-week average rose for the third straight week, up 11,750 to 468,750. The average hit a low of 440,750 in early January before the run higher. A month-to-month comparison of the four-week average against December shows little change. Equities and commodities fell in immediate reaction to the data.


Here is a chart of the data:


Notice the 4-week moving average also moved higher in the late summer before continuing its
downtrend. That does not mean we will see the same event here. However, the overall trend is still lower.

ISM Non-Manufacturing Index Shows Increase

From the ISM:

"The NMI (Non-Manufacturing Index) registered 50.5 percent in January, 0.7 percentage point higher than the seasonally adjusted 49.8 percent registered in December, indicating growth in the non-manufacturing sector. The Non-Manufacturing Business Activity Index decreased 1 percentage point to 52.2 percent, reflecting growth for the second consecutive month. The New Orders Index increased 2.7 percentage points to 54.7 percent, and the Employment Index increased 1 percentage point to 44.6 percent. The Prices Index increased 1.6 percentage points to 61.2 percent in January, indicating an increase in prices paid from December. According to the NMI, four non-manufacturing industries reported growth in January. Respondents' comments overall are cautiously optimistic about business conditions."


Here is a chart of the relevant data:


Notice the reading has been right at the expansion/non-expansion level for the last 5 months. The index has not been able to get meaningfully above this number. That indicates that while there is an expansion, it is weak. This is born out by the following points from the report:

The four industries reporting growth in January based on the NMI composite index are: Other Services; Utilities; Information; and Wholesale Trade. The 11 industries reporting contraction in January — listed in order — are: Arts, Entertainment & Recreation; Mining; Retail Trade; Transportation & Warehousing; Management of Companies & Support Services; Professional, Scientific & Technical Services; Health Care & Social Assistance; Finance & Insurance; Educational Services; Public Administration; and Accommodation & Food Services.


The majority of industries are still contracting. That means the four growing industries are offsetting 11 poorly performing industries. Ideally, we'd like to see that number reversed.

However, consider this from the report:

The eight industries reporting growth of new orders in January — listed in order — are: Construction; Information; Wholesale Trade; Other Services; Utilities; Accommodation & Food Services; Educational Services; and Health Care & Social Assistance. The eight industries reporting contraction of new orders in January — listed in order — are: Arts, Entertainment & Recreation; Management of Companies & Support Services; Retail Trade; Mining; Finance & Insurance; Transportation & Warehousing; Professional, Scientific & Technical Services; and Public Administration.


The number of industries with an increase in new orders are even -- half are reporting increases and half are reporting decreases. Hopefully that means we'll start to see a broader based service sector expansion in the next few month.

A Review of the Benchmark Revision and Seasonal Adjustment for January

Tomorrow, the Bureau of Labor Statistics (BLS) is going to publish its employment situation report for January and it will show job losses exceeding 2 million (and quite possibly over 3 million jobs lost). They (the BLS) are going to gloss over this with their seasonal adjustment, which may not only hide these losses, but show a potential gain in jobs for January. Do not be fooled, the seasonal adjustment is just an internal BLS code for fudging the numbers.
The seasonal adjustment to the employment situation report for the January job numbers has averaged +1.62% over the last five years and is used to offset the holiday firing that typically is associated with January (which the BLS also discounts on the hiring side by large negative seasonal adjustments in November and December). That 1.62% may look small, but remember we are dealing with roughly 130 million employed persons, so that 1.62% is a huge adjustment. Since 1999 the average January lost 2.8 million jobs on an unadjusted basis. The entire point of using seasonal adjustments is to eliminate the well-known effects of seasonality on job creation so we can see what the underlying economy is doing (we also subtract a ton of jobs in May and June every year to account for summer hiring). There is nothing wrong with this adjustment and it is based on years of data.

Now, the number to examine in this report will be the adjustment itself. In both November and December, the BLS used higher than normal negative adjustments (ie they subtracted more jobs than normal), which seemed odd to me since holiday hiring was expected to be down last year and last year the January adjustment was +1.535%, so we need to look for an outlier seasonal adjustment before critiquing the data (ie greater than 1.65 or less than 1.535). Any number in that general range (I used the 1.65 since that was the average without last year included) would seem to be inline with past adjustments for seasonal firing, while a number outside that range would need to be accounted for through additional data collection/reasoning. Do not believe the case that the BLS is "covering up" more job losses through its seasonal adjustment, as it is simply not true.

On to the much publicized benchmark revision that will be included with the January Employment Situation Report (like it always is).
Each year, the Current Employment Statistics (CES) survey employment estimates are benchmarked to comprehensive counts of employment for the month of March. These counts are derived from state unemployment insurance (UI) tax records that nearly all employers are required to file.

What this is intended to do is adjust the survey numbers (remember the jobs numbers come from a survey of employers, which is not combined with the unemployment rate that comes from a separate survey of households) to the actual job counts from filings (ie the revision is essentially the actual margin of error for the establishment survey for the year). This year, the benchmark revision is going to be huge, likely coming in at 824,000 jobs that were lost through March of 2009. AS you can see by the table in this link the revisions have been all over the place (ie both positive and negative), which shows there is no inherent bias in the survey towards one side (the data goes back to 1979).

Just to be very clear, the benchmark revision has nothing at all to due with the unemployment rate. These numbers come from two completely different surveys (the establishment survey interviews employers, and the household survey interviews households). The household survey (to which the benchmark revision is not applicable) gives us the unemployment rate and thus the benchmark revision does not imply at all that the unemployment rate should have been different because of the revised establishment survey numbers. Anyone claiming that the benchmark revision means that the unemployment rate was artificially low last year has no clue what they are talking about.

As for tomorrow's actual jobs number, the consensus is for 0 job gains/losses with a range (from surveyed economists) of (40,000) to +75,000 jobs. Keep in mind that the margin of error for a given month is about 100,000, so the multi-month direction of the report is going to be much more important that the actual number (assuming it falls within +/- 100,000 of 0).

Hopefully this was helpful as an educational piece ahead of tomorrow's important employment situation report.

Initial Jobless Claims: 480,000; Productivity gains in 4Q; Strong January same store sales

- by New Deal democrat

The BLS reported that seasonally adjusted initial jobless claims rose 8,000 last week to 480,000. The 4 week moving average rose 11,750 to 468,750.

Unadjusted, initial claims rose 28,234 to 530,405, down from 682,176 in 2009.

It is now clear that the ~430,000 readings of late December reflected an over-generous seasonal adjustment. Today's readings, as last week's, are totally consistent with the underlying declining trend since last March. If we go over 500,000 in the next few weeks, or fail to decline further, that could spell trouble, but not now.

Productivity for 4Q 2009 was up 6.2%, continuing the strong trend of employers making more with fewer employees. Probably not coincidentally, January same store sales were reported as strongly positive earlier this morning. Federated's executive, on CNBC, said it wasn't due to increased consumer demand, but due to better "just-in-time" inventory management, meaning stores did not have to resort to reduced sale prices in order to move merchandise.

Thursday Oil Market Round-Up


Notice that oil prices are consolidating in a triangle pattern.


A.) Trend breaks can be very tricky. Some traders are very strict regarding when a trend break is a real trend break -- the slightest penetration of a trend line is a break. Others are more lenient. There is no correct method -- it's as much an issue of feel and interpretation as fact. Also note that commodities were dropping at point (A) as a result of China raising interest rates. In other words, there was a fundamental reason for the drop in conjunction with a technical reason.

Wednesday, February 3, 2010

Today's Market


Prices stayed in a very narrow range today, which is to be expected. Everyone is waiting for the employment report on Friday.

A.) Note that prices stayed right above the 200 minute EMA.

Also consider the following chart:

ADP Sees Employment Drop of 22,000

From ADP:

Nonfarm private employment decreased 22,000 from December 2009 to January 2010 on a seasonally adjusted basis, according to the ADP National Employment Report®. The estimated change of employment from November to December 2009 was revised by 23,000, from a decline of 84,000 to a decline of 61,000. The January employment decline was the smallest since employment began falling in February of 2008.

January’s ADP Report estimates nonfarm private employment in the service-providing sector increased by 38,000, the second consecutive monthly increase. However, this employment growth was not enough to offset continued losses in the goods-producing sector. Employment in the goods-producing sector declined 60,000, with employment in the manufacturing sector dropping 25,000. The employment decline in the manufacturing sector was the lowest since January of 2008.


Here is a chart from the report:


Manufacturing/goods producing is still taking a big hit -- down 60,000. However, service employment grew for the second month. Also note that it's the small and medium service firms hiring rather than the large firms. The following charts shows the service sector employment pace in more detail:


And in an interesting, "I wonder why" vein:


Medium size firms are adding to payrolls.

The Face of US Manufacturing is Changing

From the WSJ:

America's industrial base is undergoing its most radical restructuring in decades as manufacturers rethink their businesses in the wake of the recession.

From Dow Chemical Co. to Intel Corp., iconic companies are telling stories of wrenching change—both contraction and recovery—as they report their earnings for 2009.

Dow Chemical said Tuesday it is aiming to shed some $2 billion worth of basic-chemical factories and other assets this year as it moves into more-profitable specialty chemicals. Appliance maker Whirlpool Corp. said it cut about a tenth of its capacity in 2009 as it struggled with a 9.6% drop in sales. Intel, by contrast, is investing billions of dollars in its U.S. plants as demand for computer gear recovers.

"We are emerging from one of the most challenging economic environments we've seen in decades," said Whirlpool Chief Executive Jeff Fettig, in a conference call Tuesday. "We view 2010 as a full year of recovery for our company."

The latest moves are accelerating the U.S. manufacturing economy's longer-term decline, as well as its shift away from heavy sectors, such as automobiles and basic chemicals, toward higher-tech products like super-fast computer chips. In some cases, as with auto makers, companies are shrinking to adjust to diminished U.S. demand or investing in smaller, more efficient facilities. In others, companies such as chemical makers are relocating labor-intensive operations to countries where workers are cheaper.

Consider the following charts:

On a seasonally adjusted basis, total employment has dropped by about 7 million jobs. Of that total


About 61% (about 22.5 million to 18.25 million) of those losses is from goods producing industries. That means the big areas of loss for this recession is in manufacturing. Underseath the surface we see the following changes:

The restructuring now under way offers insights into what kinds of goods the U.S. should produce, and in what volumes. In industries such as automobiles, housing and appliances, the move to shed capacity is at least partly correcting distortions that built up over many years of easy credit and profligate consumer spending. Companies now are adjusting to lower demand.

.....

The situation is different for semiconductor makers, which saw U.S. demand recover sharply as computer makers scrambled to catch up with a pickup in business investment toward the end of 2009. Intel, which produces chips in Chandler, Ariz., Rio Rancho, N.M. and Hillsboro, Ore., boosted its capital investments to $1.08 billion in the fourth quarter, up 15% from the previous quarter and part of a two-year, $7 billion program to upgrade its U.S. plants.


"Jingle Mail" for ARM resets: a Good Thing?

- by New Deal democrat

There's a lot of buzz this morning about a NY Times article documenting the increasing number of homeowners who are "doing the math" and deciding it makes no sense to continue paying the mortgage. They are simply letting the bank have their property, and walking away, a/k/a "jingle mail."

[B]y the third quarter of 2009, an estimated 4.5 million homeowners had .. their home’s value dropping below 75 percent of the mortgage balance.
....

[A] growing body of research indicates that significant numbers of borrowers are declining to live under what some waggishly call “house arrest.”

Using credit bureau data, consultants at Oliver Wyman calculated ... that about 17 percent of owners defaulting in 2008, or 588,000 people, chose that option [of walking away] as a strategic calculation.

I'd like to challenge the conventional wisdom (I know, you're shocked) and suggest that this is probably a good development, placed in larger context.

One of the most widely used graphs in the blogosphere a few years ago was this one, dating from January 2007 ("month 1" in the description) showing an initial wave, now passed, of subprime ARM resets, and a subsequent wave of option-ARM and jumbo resets and recasts (picking up steam now and really taking off later this spring):


The typical argument, set forth among other places in a leading article at the place where I used to blog, is that this means that foreclosures are about to explode, more homeowners will be living out of cardboard boxes and we are all Doomed!!!

My rejoinder has been that these homeowners presumably did not spend the last 3 years like deer in the headlights, but did occasionally notice the housing implosion happening all around them, and many if not most may have already taken action, such as selling the place early for as much as they could get. The Times article suggests I've been right:

Mr. Koellmann ... bought a small, plain one-bedroom apartment for $215,000.... He put down 20 percent and received a fixed-rate loan from Countrywide Financial.

Not quite four years later, apartments in the building are selling in foreclosure for $90,000.

“There is no financial sense in staying,” Mr. Koellmann said. With the $1,500 he is paying each month for his mortgage, taxes and insurance, he could rent a nicer place on the beach, one with a gym, security and valet parking.
Don't know about you, but to me Mr. Koellman's actions look perfectly rational. And as the article mentions, there are a burgeoning number of people just like him.

Undoubtedly this will drive the price of houses down even further, but as this graph of Case-Schiller house prices shows, they need to drop further to get back to a more normal valuation:


So in other words, the series is: homeowner walks away ---> gets cheaper, better apartment or house ---> housing prices go down further, becoming more affordable ---> foolish (bank) creditors take the haircut, debtors can increase new spending and stimulate the economy.

I'm trying to figure out what the downside is in all this ....

Wednesday Commodities Round-Up

Over the last few weeks we've had some interesting developments in the commodity markets. The big development was the Chinese tightening their lending standards. In addition, the dollar has rallied. As a result, commodities have dropped. Consider these charts that show commodities breaking important trend lines:


Tuesday, February 2, 2010

Today's Market


A.) Prices retreated to the 50% Fibonacci level and then rallied. But


A.) Prices haven't been this far below the 50 day EMA since the Spring.

Federal Reserve Releases Senior Loan Officer Survey

Yesterday, the Federal Reserve issued the Senior Loan Officer Survey. Here is a summation of the reports findings:

The January survey indicated that commercial banks generally ceased tightening standards on many loan types in the fourth quarter of last year but have yet to unwind the considerable tightening that has occurred over the past two years. The net percentages of banks reporting tighter loan terms continued to trend lower.2 Banks reported that loan demand from both businesses and households weakened further, on net, over the survey period.

For many major loan categories covered by the survey, the net percentages of respondents that tightened standards in the fourth quarter of 2009 were close to zero. However, banks continued to tighten a number of terms on loans to both businesses and households, although the net fractions of banks that reported doing so in the January survey generally stepped down again. Banks' policies on commercial real estate lending were an exception, as large net fractions of respondents further tightened their credit standards during the final quarter of last year. In addition, banks reported that they had tightened terms on CRE loans substantially over the past year.

Demand from both businesses and households for all major categories of loans weakened further, on net, over the past three months. The net fractions of banks that reported weaker demand for business loans continued to decline, while changes in the comparable readings on demand for loans to households were mixed.


Here are the relevant charts from the report. Click on all charts for a larger image:


The percentage of lenders tightening standard for commercial and industrial loans (C and I loans) is now at 0. However, loan demand is still weak.

The percentage of lenders tightening standard for commercial real estate (CRE) loans is decreasing, but loan demand is still weak.
The percentage of lenders tightening standards for consumers loans is now at 0, but demand is still weak.


The percentage of lenders tightening lending standard for residential real estate loans is decreasing, but demand also dropped last quarter.

Personal Savings and the Expansion

- by New Deal democrat

When the personal income and spending reports came out yesterday, I remarked to Bonddad that it was about as good as could be hoped for in one month's data in the current environment: spending was up enough to keep the expansion going, income was up even more, and savings were also up - a long term benefit.

Back in summer of 2007, before the "Great Recession" officially began, I used to describe what was about to happen as a "s l o w m o t i o n bust," meaning it was going to be a 19th century style deflationary bout, but would occur as the 20th century bulwarks gave way one by one, kicking and screaming, although there would undoubtedly be some very bad days (September-October 2008, anyone?). I believe Paul Krugman refered to it as "not your father's recession." Indeed, it could be called your great grandfather's recession.

But those 19th century panics did repair themselves, although some of them, like the Panic of 1873, took the better part of a decade to really abate. Once they hit bottom, as consumers repaired their balance sheets suddenly and in unison, spending and expansion slowly resumed.

Yesterday's data calls that to mind, so let me show you how the consumer, in the aggregate, is faring.

Consumers are paying down or refinancing debt at lower rates and/or amounts, and have reversed the entire last decade of debt service expansion:

Consumers are a little over halfway to the more normal level of debt service from the 1980s and earlier 1990s.

Their real disposable income has been increasing slowly over the past year:


With increased disposable income, and decreasing debt service obligations, Americans are saving more. As of December, the personal savings rate was 4.8%:

meaning that, on a per capita basis, consumers are a little less than half the way back to their longer term savings rate before the middle class gutting commenced.

In the aggregate, personal savings rose from $126.3 Billion in the 1st quarter of 2008 to $595.7 Billion in the 2nd quarter of 2009 (blue line), and are at $516.9 Billion now, which can be compared in "real" terms by factoring in the inflation rate (the red line):

-- meaning that at its peak in spring of last year, as much personal savings was available to be spent in the economy in real terms than at any point since early 1984.

Courtesy of the St. Louis Fred's new toy, we are able to divide aggregate personal savings by the inflation rate, and graph "real personal savings":

-- confirming that there is more "fuel" for continued economic expansion than at any time in nearly 30 years.

Of course, the "average" includes a huge skew savings and wealth towards the uppermost portion of wealth, so much so that Andrew Kaplan suggeted half a year ago that “The Savings Rate Has Recovered…if You Ignore the Bottom 99%”, by which he meant that the entire amount of savings above could potentially exist entirely in the top 1% of society. That's not the case, but as Lakshman Achuthan of ECRI pointed out a few months ago:

If you are earning over $100,000, then your plans are to spend over 50% more than last year. That’s stunning. Equally stunning was that if you are making less than $30,000, then you are going to cut your spending by a third.

In a related backdrop, the wealthiest consumers, say those in the top decile of earnings and net worth – and this is not something new – account for almost half of all spending. The lower 90% account for the other half.
In other words: personal savings have improved to the point where it can power at least a modest expansion -- but it is still a "Gilded Recovery."

Treasury Tuesdays


A.) Prices dropped in December, falling from 93.10 to 88.6 -- a drop of nearly 5%.

B.) The dashed diagonal line in the Fibonacci calculation also serves as a trend line. Prices broke this line at point B.

C.) Prices have risen to the 50% Fibonacci retracement level and have falled back to the 38.2% Fibonacci level.

Notice the EMA positions.

-- Prices are below the 200 day EMA

-- The 10 and 20 day EMA have moved sideways indicating a neutral price path

-- Prices and the EMAs are in a tight range, indicating traders don't know where to send prices next.

Monday, February 1, 2010

Today's Market


Prices are below all the EMAs.

The 10, 20 and 50 day EMA are moving lower

The 10 day EMA has crossed below the 20 and 50 day EMA

the 20 day EMA is about to cross below the 50 day EMA.

Personal Income Increases

From the BEA:

Personal income increased $44.5 billion, or 0.4 percent, and disposable personal income (DPI) increased $45.9 billion, or 0.4 percent, in December, according to the Bureau of Economic Analysis. Personal consumption expenditures (PCE) increased $22.6 billion, or 0.2 percent. In November, personal income increased $61.1 billion, or 0.5 percent, DPI increased $60.7 billion, or 0.5 percent, and PCE increased $69.1 billion, or 0.7 percent, based on revised estimates.


Let's take a look at the report's details. Click on all images for a larger image.


Goods producing industries are seeing wage declines. This is to be expected, as this area of the economy is still seeing large job losses.


However, wages in the service sector -- the largest employment sector of the economy -- are increasing, and have been since May.

In addition,


Overall disposable income is increasing.


PCEs -- personal Consumption Expenditures -- continue to increase on a month to month basis.


Above is a chart of the percentage change from the preceding period in the various sub-parts of the PCE number starting in May.


The savings rate in hovering right around 4.5% - 4.8%.