Friday, January 22, 2010

Weekly Indicators (with special graph of Daily Treasury Receipts)

- by New Deal democrat

This week we got good reports and Housing Permits and Starts. Both are up on a YoY basis for the first time since the housing bust began, starts just barely, permits substantially. Permits also rebounded from their recent surprise decline, Starts were down from last month and basically meandering sideways for the last 6 months.

Edmunds "cautioned that the seasonally adjusted annual rate for U.S. auto sales could be 10.5 million in January." That would be the lowest rate in 3 months. Auto sales are seasonal, so just as good sales in December weren't good enough for a positive real retail sales report, this month might not be "bad" enough for a poor real retail sales report.

Leading Economic Indicators for December were up 1.1%. On a YoY basis, they are now up over 7%. This is the best YoY performance in nearly 25 years except for a brief period in 2003, and portends strong growth for this quarter and at least the beginning of next quarter.

Turning to the high frequency weekly indicators, the ICSC reported same store sales for the week of January 16 up 2.0% from the week before and up 2.6% from the year before. This isn't as good as it sounds, since inflation is running close to 3% at the moment.

Similarly, Shoppertrak reported sales down (-7.6%) from the prior week, and up a slight +0.8% on a YoY basis.

Railfax showed cyclical and intermodal traffic up vs. a year ago (which was the exact bottom). Comparisons start getting hard this week. If numbers don't improve, both may be negative YoY again, but seasonality makes that unlikely.

The BLS reported initial jobless claims of 482,000 last week, and the 4 week average went up to 448,250. There was an indication that this reflected an administrative backlog, i.e., the last two week's numbers should have been worse, and this week's better. Recall that a week ago I said that the seasonal adjustment was probably too optimistic, and to expect the weekly claims number to rise to about 480,000, which would in no way disturb the year-long declining trend. Next week the seasonal changes pretty much wash out. So long as the jobless number next week begins with a 4 and not a 5, the trend is still in place.

Oil has declined to $75 a barrel, which is good, and gasoline at $2.74 also declined slightly from last week, but is still above its range for the last few months. Usage is in seasonal decline, but more ominously is on the verge of going negative YoY.

Now our special bonus, h/t Angry Bear, the following graph of Daily Treasury Withholding Receipts (red lines), and YoY 5 day smoothed average (black dotted line):


The YoY went negative in October 2008 (almost a year after the recession started) and appears to have bottomed in October 2009. If it takes until October 2010 to turn positive, that suggests the actual seasonally adjusted bottom might not be until this spring, which obviously puts the states and federal budgets under severe distress.

But the YoY average might turn up more quickly. As of January 20, the Daily Treasury Statement showed $96.6B in withholding taxes pain this months, compared with $101.0B on the same date last year, a decline of (-4.4%).

In the next 60 days or so, given the tougher YoY comparisons, we should have a good idea how sustainable the recovery is going to be. This week, the comparisons in retail sales, gasoline, and rail traffic looked worrisome.

Regulators Doing Their Job

From Bloomberg:

U.S. banking supervisors are using existing authority to raise standards for capital, liquidity and risk management without waiting for the Obama administration and Congress to hammer out a new regulatory structure.

Agencies led by the Federal Reserve and the Office of the Comptroller of the Currency this year are set to propose rule revisions that would increase the amount of capital large banks must set aside against the risk of trading losses, according to government officials. The revisions would follow recommendations of the Basel Committee, the global coordinator for banking regulations based in Switzerland.

U.S. regulators are also proposing stronger guidelines on liquidity risk and this month told banks to improve strategies to guard against the possibility of an abrupt increase in interest rates. The renewed scrutiny comes as firms that received taxpayer support, including Goldman Sachs Group Inc. and JPMorgan Chase & Co., report earnings swelled by gains from securities trading.

“You have got more intensive, more intrusive and more forceful supervision,” said Richard Spillenkothen, a former director of the Fed Board’s Division of Banking Supervision and Regulation and now a Washington-based director at Deloitte & Touche LLP. “Regulators believe going into this crisis in 2007 that capital positions were too low and the liquidity cushions were not sufficiently robust.”

Just think what would have happened if they had done this a few years ago ...

LEIs Up 1.1

From the Conference Board:

The Conference Board Leading Economic Index™ (LEI) for the U.S. increased 1.1 percent in December, following a 1.0 percent gain in November, and a 0.3 percent rise in October.

.....

Says Ataman Ozyildirim, Economist at The Conference Board: "The Conference Board LEI for the U.S. increased sharply in December, and has risen steadily for nine consecutive months. The six-month growth rate has picked up slightly to 5.2 percent (about a 10.8 percent annual rate) in the period through December, substantially higher than earlier in the year. In addition, the strengths among the leading indicators have remained very widespread in recent months."

Adds Ken Goldstein, Economist at The Conference Board: "The indicators point to an economy in early recovery. The coincident economic index shows slow expansion of economic activity through December. The leading economic index suggests that the pace of improvement could pick up this spring."

Here are the internals:

Click for a larger image.

Note there was improvement across a variety of indicators -- that is, nine of the components showed some type of improvement.

The Conference Board Coincident Economic Index™ (CEI) for the U.S. rose 0.1 percent in December, following a 0.1 percent increase in both November and October. The Conference Board Lagging Economic Index™ (LAG) declined 0.2 percent in December, following a 0.5 percent decline in November, and a 0.2 percent decline in October.

Here is a chart of those numbers:

Note that three of the four components have been increasing for at least four months.


Forex Fridays


A.) There are four gaps higher in the first leg of the dollars rally.

B.) This is followed by a pennant pattern consolidation.

C.) After retreating to the 50% Fibonacci level, prices continued their upward climb, again gapping higher on several occasions.


A.) The MACD has given a buy signal,

B.) Money is flowing into the stock, and

C.) The EMAs are in a bullish configuration, although in a newly bullish configuration. That means ideally we'd like to see more time in this alignment.

Thursday, January 21, 2010

Today's Market


The SPYs sold off on big volume. Prices moved through support and two EMAs, printing a very long red bar.


The QQQQs sold off on big volume. Prices moved through support and two EMAs, printing a very long red bar.

This is how market corrections start.

Philadelphia Fed Shows Expansion

From the Philadelphia Federal Reserve:

The survey's broadest measure of manufacturing conditions, the diffusion index of current activity, decreased from a revised reading of 22.5 in December to 15.2 this month.* The index has now remained positive for five consecutive months (see Chart). Indicators for new orders and shipments suggest continued growth this month, but they also declined somewhat from their December readings. The current new orders index, which has remained positive for six consecutive months, decreased 5 points. The current shipments index fell 4 points. The current inventory index, although still negative, increased 4 points, to its highest reading in 26 months. Indicators for unfilled orders and delivery times edged higher and are both positive, suggesting stronger economic conditions.

Labor market conditions have been stabilizing in recent months, and for the second consecutive month, the percentage of firms reporting an increase in employment was higher than the percentage reporting declines. The current employment index increased 2 points, to its highest reading since February 2008. The workweek index fell back 2 points but has now been positive for three consecutive months.


Here is a chart of the data:


The regional manufacturing surveys were some of the original data points that turned positive. They continue to indicate growth ahead.

Jobless Claims +36,000

From Bloomberg:

Distortions cloud what on the surface is a negative jobless claims report. Initial claims jumped 36,000 in the Jan. 16 week to 482,000, marking a third straight increase and the fifth increase in five weeks -- not a streak that points to improvement in the labor market (Jan. 9 week revised 2,000 higher to 446,000). The four-week average, at 448,250, rose 7,000 in the week to snap a long streak of uninterrupted improvement going back to August.

Now the special factors. The Labor Department said claims piled up due to short holiday staffing at state processing centers. Market News International is quoting a Labor Department analyst as saying the week's gain is "not economic, but administrative." Starting with the next report, the government analyst expects the effect to reverse making for a steady decline in coming weeks. An implication here is that short-staffing this year was greater than prior years and is not offset by seasonal adjustments. Note also that data from an unusually large number of seven states had to be estimated for the current report.


From CNBC:

The number of U.S. workers filing new applications for unemployment insurance unexpectedly rose last week as claims delayed from the year-end holidays were pushed through, government data showed on Thursday.


In essence, the previous weeks numbers should have been higher, but were not because applications were delayed for various reasons. We'll have to see how that dynamic plays out in the next few weeks.

The 4-week moving average posted in increase, but this was the first one in 19 weeks. In other words, this increase is against the prevailed trend of claims.

Obama to Limit Bank Sizes

From the NY Times:

President Obama on Thursday will publicly propose giving bank regulators the power to limit the size of the nation’s largest banks and the scope of their risk-taking activities, an administration official said late Wednesday.

.....

The president, for the first time, will throw his weight behind an approach long championed by Paul A. Volcker, former chairman of the Federal Reserve and an adviser to the Obama administration. The proposal will put limits on bank size and prohibit commercial banks from trading for their own accounts — known as proprietary trading.

.....

Only a handful of large banks would be the targets of the proposal, among them Citigroup, Bank of America, JPMorgan Chase and Wells Fargo. Goldman Sachs, the Wall Street trading house, became a commercial bank during this latest crisis, and it would presumably have to give up that status.

“The heart of my argument,” Mr. Volcker said, “is who we are going to save and who we are not going to save. And I don’t want to save what is not at the heart of commercial banking.”


I wrote the following a few weeks ago:

Regarding wall street firms, you have two choices:

1.) Allow big institutions to exist, but regulate them with a regulator who has teeth and is willing to use its teeth.

or

2.) Reinstate Glass Steagall


It looks like the administration is going after number 2. Let's see if they actually do something or if the idea gets killed in Congress.

Thursday Oil Market Round-Up

Let's tale a look at the recent sell-off. Click for a larger image.


A.) Prices formed a three day broadening pattern -- a topping/reversal pattern

B.)Prices gapped down twice after forming the top.

C.) Prices hit resistance right around the 200 day EMA

D.) Prices have continued moving lower after moving through the 200 day EMA.

In addition, consider this chart:


A.) Prices are consolidating in a triangle pattern right around the 200 day EMA.

Wednesday, January 20, 2010

Today's Market

From Investopedia on buying climax:

Following a protracted period of selling or buying, a point wherein market trends are retarded or discontinued.

At a selling climax, the market is characterized by a trend reversal whereby the market begins to buy stocks and prices rise. For a buying climax, the opposite occurs, and the market begins to sell, resulting in lower prices. The climax is merely the highest point of selling or buying and can be followed by many trend reversals.


A.) Prices have been in a range for the last two weeks

B.) Volume has been increasing.


A.) Prices have been in a range and

B.) Volume has been increasing


A.) Prices have been in range and

B.) Volume is increasing a bit, but not to the degree as the SPYs and QQQQs

Housing Starts Down 4%; Permits Up 10%

From Bloomberg:

Building permits in the U.S. unexpectedly jumped in December, signaling gains in housing will be sustained into 2010 after winter weather depressed construction at the end of last year.

Applications rose 11 percent to a 653,000 annual rate last month, the most since October 2008, the Commerce Department said today in Washington. Work began on houses at a 557,000 pace, down 4 percent from November.

Builders are probably anticipating sales will increase after the government extended a tax credit for first-time buyers through June and expanded it to include some current owners. Record foreclosures and unemployment near a 26-year high represent hurdles that may prevent the industry from strengthening much further.


Note that the number of starts has been consistent for about 8 months. Yes -- it's at a low level. While new home inventory has been dropping builders are still concerned about overall demand. Hence the low rate of growth.
------------
Note by NDD:

There is a certain very well-known blog which, month after month, has been complaining about the reporting of housing starts and permits, among other housing data, because the reporting has failed to note that the situation is awful because the numbers showed Year-over-Year declines.

Well, today both the permits and starts numbers were positive YoY, starts just barely but permits by a substantial amount. So what did that blog have to say about the YoY numbers today? Nothing, that's what.

PPI Up .2%

From the BLS:

The Producer Price Index for Finished Goods moved up 0.2 percent in December, seasonally adjusted, the U.S. Bureau of Labor Statistics reported today. This rise followed a 1.8-percent advance in November and a 0.3-percent increase in October. At the earlier stages of processing, prices received by producers of intermediate goods rose 0.5 percent and the crude goods index moved up 1.0 percent. On an unadjusted basis, prices for finished goods advanced 4.4 percent in 2009, after falling 0.9 percent in 2008.


This is good news on several fronts. First, you want a little inflation (how much is "a little" is debatable.) However, a little inflation indicates that somewhere in the system there is either enough cost push or demand pull inflation to keep prices moving higher. Secondly, a deflationary threat got us into this mess. These numbers indicate that the deflationary scare is receding. This is clearly illustrated in this 12-month chart of the YOY change in PPI:


Click for a larger image

It's important to remember the YOY number is subject to an incredibly low comparison number. As a result, higher numbers on the YOY comparison are likely for some time.

China Adds Further Tightening Measures

From the WSJ:

Bank Of China Ltd. has ordered its credit officials to halt any new yuan loans due to overly fast lending growth so far in January, a person familiar with the situation said Wednesday. The headquarters of the state-controlled lender has issued a notice to all of its branches to stop issuing new yuan loans and also curb foreign-currency denominated new loans, said the person, adding that the bank didn't say in the notice when new yuan loans will resume.

Any new loans, if they were to be extended, would have to be approved by the bank's headquarters, the person said.

In a statement, Bank of China said its new loans in the first 20 days of January has been high and that it will take a closer look at its lending, though it didn't say whether it had suspended lending.


And from another WSJ story:

This concern about bank lending comes at a time when global markets are already worried that an increase in Chinese bond yields and last week's rise in banks' minimum reserve requirement herald the start of a tightening in interest rates.


The US is not the driver of this recovery -- Asia is. So any tightening of credit by an Asian official/institution is going to have negative implications for all financial markets.

Wednesday Commodities Round-Up


A and B are the primary trend lines -- both of which have held.

C, D, and E are areas of resistance that prices have moved through. These lines are now support in the event of a downward move.


A.) The 10 day EMA is now moving sideways while the 20 and 50 are still moving higher. Because the 10 day EMA is shorter than the other EMAs it is far more volatile.


A.) The MACD rose from mid November to early January, but has given a signal. But also note that prices have moved into the upward sloping trend line but not moved lower.

B.) There has not been a big move into or out of the DBBS since early December.

Tuesday, January 19, 2010

Today's Market


A.) Prices started off strongly, printing many strong bars on strong volume.

B.) Prices consolidated in two triangle patterns.

C.) Prices stabilized from about 11:30 - 2 EST, trading in a narrow range and using the 10 and 20 minute EMA as support.

D.) Prices ended the day on an upswing.

The Fits and Starts Expansion, Part II

Now that everyone on the blog is making predictions about 2010, I thought I would update my belief about the economy for 2010. On August 31, I wrote an article titled The Fits and Starts Expansion. I identified five sources for growth in 2010. These areas were consumer spending, inventory adjustments, stimulus spending, Asian consumers/exports and manufacturing as the five areas that would provide growth. I am going to update these ideas in the paragraphs that follow

Consumer Spending


The two paragraphs that follow were from the original article. I still believe in the fundamental analysis presented therein. I have added additional points in brackets with the text emboldened.

The general opinion of the US consumer is that he will change his overall behavior from one of spending to one of savings and frugality. This in fact has already occurred to an extreme degree. There are several reasons for this. Unemployment is high and will remain at that level for the foreseeable future. When a person does not think he will be able to find a job if he losses his current job than he will spend less today. In addition, household debt is at very high levels and the consumer -- who has been paying down debt and shunning new debt -- will continue to do so [this trend has continued. Total household debt outstanding is decreasing and the household financial obligations ratio continues to decrease]. This will lead to an increase in savings which will lower consumption.

However, there has been an underlying assumption to this argument that the US consumer will stop buying to such a degree as to be a non-factor in GDP. In other words, the consumer will move from a position of being a fundamental driver of US growth to having little to no impact. That is a radical view -- and one I believe to be incorrect for two reasons. First, from a practical side things wear out and need to be replaced. The US consumer cannot eliminate the need to replace things. In addition, as the consumer holds onto goods longer, other items need to be purchased -- replacement parts and the services to fix items. In addition, the economy will not always be in its current position; at some point the unemployment rate will return to manageable levels, salaries will increase and asset valuations will be stable. When this occurs the consumer will feel more confident and will be more willing to spend on goods and services. However, the old consumer -- the one who spent wildly on everything -- will not return.


Nothing has changed in my opinion of the consumer since writing the preceding paragraphs. Consider the following two graphs that illustrate the points:


Click for a larger image.

Above is a chart of the year over year percentage change in personal consumption expenditures. Notice that since 1960 these have found a sweet spot between -2.5% and 5%. This is the rate of growth we are use to. However, there is nothing written that says the number could be gravitate between ~0% and 2%. That would still give the economy some momentum, simply not as much as before.

In addition, consider this chart:


Click for a larger image.

Above is a chart of the quarter to quarter percentage change in PCEs starting in the 1Q80. Notice how these have found a comfort range in the ~2%-4% range for the vast majority of the time since 1Q80. However, suppose this number ranged between ~0% and 2%. This would be in line with slower growth and a more cautious consumer. While the latest number was 2.8% (3Q09) I would have no problem with the number ranging at a lower level.

The point to the preceding charts is simple: overall, the US is use to PCE growth at a fairly quick pace. Yet there is nothing suggesting that number couldn't slow down yet still remain positive. A slower pace of growth would be consistent with a more cautious and value oriented consumer.

Finally, consider this chart of real month over month PCE's:


Notice the real PCEs are clearly in an uptrend.

Inventory Adjustments.


Over the great recession inventories have contracted at a very fast pace. Consider the following chart of total inventories:


Note the large drop from (roughly) mid-2008 to mid-2009. However, as the chart also shows, this drop has stopped over the last few months and begun creeping upward. In addition,


The sales/inventory ratio is back at pre-recession levels. This indicates that inventories are incredibly lean and have to be added to. The increase in inventories for a variety of business interests started in the fall:

Business inventories rose 0.4 percent in November, the same rate of build posted in October (plus 0.2 percent initially reported). November and October mark the cycle pivot and apparent end to the inventory correction. The pivot has been led by wholesalers where inventories jumped 1.5 percent together with a 0.6 percent rise in October and vs. a long prior string of big draws.

Inventories of manufacturers show the same pivot to a lesser degree, up 0.2 percent in November and up 0.6 percent in October. Retailers looked to have been the first to pivot, showing a build in September that however was followed by no change in October and now a 0.2 percent draw for November. But November's retail draw was no doubt due to the month's big jump in sales (data revised higher in this morning retail sales report). But weak retail sales for December, together with company reports that post-holiday inventories are extremely lean, point to the possibility of further draws, or at most very slight builds, in December and January.
I made the next two points in the earlier article:

Stimulus Spending

Next year the real impact of the stimulus starts to hit. The CBO studied the Stimulus package and stated that:
Assuming enactment in mid-February, CBO estimates that the bill would increase outlays by $92 billion during the remaining several months of fiscal year 2009, by $225 billion in fiscal year 2010 (which begins on October 1), by $159 billion in 2011, and by a total of $604 billion over the 2009-2019 period. That spending includes outlays from discretionary appropriations in Division A of the bill and direct spending resulting from Division B.

The spending will occur over a variety of different governmental programs such as rural broadband development, homeland security, infrastructure, increases in unemployment benefits and a host of other programs.

In addition, there were tax provisions in the bill which would produce the following effects:
In addition, CBO and the Joint Committee on Taxation (JCT) estimate that enacting the provisions in Division B would reduce revenues by $76 billion in fiscal year 2009, by $131 billion in fiscal year 2010, and by a net of $212 billion over the 2009-2019 period.

So, between actual spending and tax reductions, 2010 should see the direct impact of roughly $350 billion ($225 in spending and $131 in tax reduction). The real issue here is the multiplier effect -- how much of a larger effect will the spending have. Frankly, we won't know until the money is spent. But next year we'll see the ripple effect of the combination of tax cuts and spending. This will help growth.


Asian Consumers/Growth

There's a great myth that goes around the Internet: the US doesn't make things anymore. If that were true, then we would have exported $1.8 trillion dollars of goods in 2008. And in 2008, we exported $108 billion of foods and beverages, $388 billion of industrial supplies, $457 billion of capital goods, $121 of automotive products and $161 billion of consumer goods. In other words, exports account for about 13% of GDP. And they may become far more important to US growth:
In the process of gorging on overseas goods and services, the US by happenstance fired up emerging economies such as China, Korea, Taiwan, India, Brazil and Mexico to build their productive capacities and spawn their own middle classes and consumer cultures. Paulsen has long called this trend the US's "emerging-market Marshall Plan."

As US consumer spending slows we will import less, thereby lowering the total amount of imports in the trade deficit formula. At the same time, Emerging economies have seen a growing middle class which will want to buy more goods and services. And some of those will come from the US.


Nothing has changed regarding stimulus spending; we are still on target to have some government money/help for the economy. I have seen people complain about this, arguing that government supported economic growth is invalid. To this point I offer the following rebuttals:

1.) Government spending accounts for at least 20% of economic growth during an expansion.
2.) Many of the people making this argument were also for the stimulus and in some cases argued the original stimulus was insufficient

In short, the US is in the middle of a standard, Keynsean style economic boost. This is exactly what is supposed to happen when the government spends money to increase overall demand.

Regarding exports, consider the following charts from Calculated Risk:


First, both exports and imports have been increasing since (roughly) the beginning of 2009. However, imports have been increasing at a slightly faster rate. This is born out by this chart from the Census Bureau's latest trade balance report:


However, most of the increase is due to petroleum imports as seen in the red line below.


However, while the export story exists -- that is, exports are increasing leading to a boost in US manufacturing -- the US appears to be moving back into its position as a net importer primarily because of oil dependence.

Finally, we arrive at manufacturing. Consider this chart of the overall ISM manufacturing index:


After hitting a multi-year low in late 2008, the index has been rising for most of 2009. This indicates manufacturing's deep contraction was overdone (as SilverOz has noted on several occasions) and that manufacturing is coming back. This ties in with the inventory story mentioned above -- as businesses restock inventories manufacturing will have to ramp up production.

St. Louis Fed Calls July 2009 Trough

For several months, I had been getting increasingly curious about the fact that the St. Louis Fed’s FRED data and economic research service was no longer indicating a vertical “recession bar” from the period starting around mid-year 2009. Finally, last week, curiousity got the best of me and I called my St. Louis Fed contact. This was his response (confirming what I’d already inferred):

Apparently the two staff economists that review the FRED charts believe July 2009 is the date they believe the NBER will announce as the end of the recession. From what I understand a similar “call” was made toward the end of the 1990-91 recession.

If I was to highlight one source they used it would be Jeremy Piger’s (University of Oregon), recession probabilities. He was a staff economist until about 4-5 years ago.

I don't agree with their assessment, but do think it noteworthy that one of our Federal Reserve banks has apparently “called” a July 2009 end to the recession. If I recall correctly, they did not add the recession bar until the NBER had officially made its call (in December 2008) that the recession had begun one year prior. So I'm not sure why they feel comfortbale making this call.

In my opinion, too many indicators are still either flatlining or declining (albeit more modestly than they had been).

Treasury Tuesdays


A.) Prices have broken through the downward sloping trend line.

B.) Prices have gapped higher, indicating upward momentum.

It's important to remember that on the flip side of the Treasury trade is an interest rate. The 10-year is currently at 3.68%. To some investors that is an attractive yield in the current environment, so they will step into the market to buy.


A.) The MACD has given a buy signal.

B.) However, we have not seen a huge rush of buyers back into the market.

Monday, January 18, 2010

No Really -- There Are Rules

First please read the guidelines for making a comment on this blog. They will clear up a lot of misconceptions.

Secondly, don't comment if you have no idea what your are talking about. As an example, if you don't know there are two employment surveys or you think that posting numeric data in a graphic format is "technical analysis," then go elsewhere. I don't have time for that type of illiterate crap.

Third, if you believe that

1.) People are "disappearing from the labor force," or

2.) The government statistics are wrong or

3.) Shadowstats is valid, or

4.) Social Security is rigging unemployment statistics

please fine somewhere else to post.

Again, there are plenty of websites that have no standards and a lack of knowledge about economics. There are also plenty of websites that routinely print ill-informed and researched information on economics. They are (regrettably) a dime a dozen. If that is your cup of tea, fine. Please visit those websites and add to the ever-increasing ill-informed conspiracy theory garbage that routinely fills the internet.

2010: Gilded Recovery, or Double Dip? (and Oil)

- by New Deal democrat

As we begin 2010, the cliff-diving declines of earlier 2009 behind us, and most economists agreeing that the Recession bottomed out sometime after June, the biggest issue before us is whether on the one hand the "Gilded Recovery" of the 2nd half of 2009 which was driven by spending by the top 10% income-earners broadens out, or does the economy sink into a new contraction, or double-dip.

The same data that indicated that the end of the recession would come during the summer of 2009, with increased industrial production, retail sales and GDP growth thereafter, enables us to see the first part of 2010 with some certainty, and provide at least some road markers to the second half of the year. The two halves may be similar, or, depending on the price of Oil, may be quite different.

I. The Near Term - Strong growth is likely

If there is one thing I have been harping on for ages, it is that forecasting based on present or past data is an excellent way to be wrong. As Caroline Baum has documented, most people simply project past trends forward, and miss turning points. Furthermore, people tend to only listen to viewpoints, and look at data, that confirms their already-decided-on opinions.

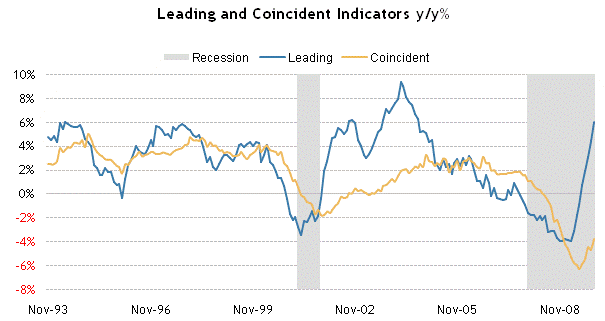
The year 2009 proved in spades Baum's point that the best way to be right about what is going to happen with the economy going forward is simply to look at the Leading Economic Indicators. They began to turn up in April, three months before the bottom in economic output - at a time when very few people besides yours truly believed that economic growth would actually begin in Q3 (for example, my friend and co-blogger Bonddad thought it would take until Q4 2009 or Q1 2010, and he was derided as an optimist). They continued to rise strongly for the rest of the year, turning a loss of nearly a million jobs in a single month at the beginning of 2009 into a small gain in November and an unrevised -85,000 in December.

The LEI's will probably be reported later this week a having had another good month in December, given the strongly positive yield curve, big improvement in initial jobless claims, rebound in housing starts, improved consumer sentiment, improved durable goods orders, and stronger manufacturing in the ISM index. On a year-over-year basis, with the exception of 2003 they will be more positive at about +6.5% to 7% than they have been at any time since the mid-1980s, as shown on this graph that is current through November:


The simple fact is, the first 3-6 months of 2010 are probably going to show growth, and indeed more strong growth than few dared to hope for in 2009. Forecasts of a 4%+ GDP report are increasing. Several weeks ago an article in financial weekly Barron's made the case for a GDP reading in excess of 5%. Even that is now tame -- Goldman Sachs just raised their guidance to +5.8%!

A big part of the improving economic picture generally, and employment picture specifically, is the necessity for manufacturers, wholesalers, and retailers to restock inventory. For the last 16 years, the government has kept track of how much sales change compared with inventories (stock on the shelf), and produced a graph of the Sales to Inventory ratio. Here it is, showing that suppliers brutally cut inventories in 2009. One big reason why the initial 3.5% GDP reading in Q3 2009 was ultimately revised down to 2.2% (still a pretty decent number) was the continuing decline in inventories -- i.e., some of the sales were not new products, but products sitting on shelves.


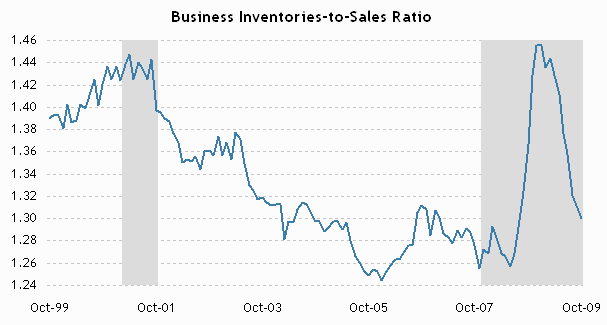
As you can see in the above graph, inventories are now as tight as they have ever been, and sales are at least slightly increasing. The need to restock shelves creates a strong need to produce new product. This directly feeds into the GDP, and directly enhances employment. Prof. Paul Krugman and Calculated Risk are calling the likely burst of GDP growth a "blip." Whether it is or not I will discuss in Part III below.

Bottom line: the first 3-6 months of 2010 are going to show growth, probably strong growth. Keep in mind that under "Okun's law", really just a rule of thumb that economists use, we need to see at least 2% YoY GDP growth(some would say as high as 3%) to be consistent with job growth. We're probably going to reach that this quarter, although we won't find out for over another 3 months until this quarter's GDP is reported later in spring.

II. The Long term - K.I.S.S. vs. Oil

The LEI do not help us out past at most 6 months. There is, however, at least one economic indicator with an excellent track record at forecasting the economy - with one important qualifier - a year out. That is the yield curve of the bond market.

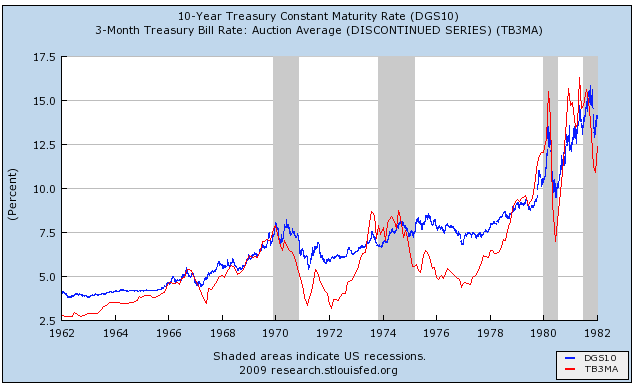
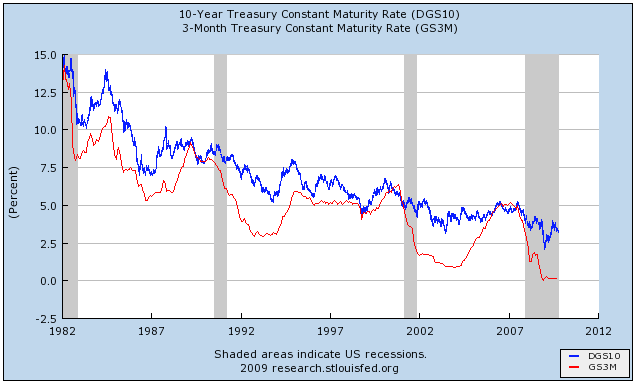
So long as there is inflation, not deflation, a positive sloping yield curve, where long term interest rates are higher than short term rates, has correctly predicted economic expansion 1 year later, without exception, since 1920, including the Great Depression. Here are two graphs of the yield curve going back all the way to 1960. As you can see, with one exception (1966), whenever the red line was higher than the blue line, meaning short term rates were higher than long term rates, there was a recession (in 1966 there was a marked slowdown, but no recession). However, EVERY time the blue line was higher than the red line, one year later there was NO recession, but instead there was economic expansion.


So, what is the qualifier? In times of deflation, the yield curve can give a misleading answer. If the deflation is accelerating, a yield curve gives no comfort. It is only when deflation is abating (prices are declining, but at a slower and slower rate) that a positive yield curve confidently predicts expansion. Here is the most important graph, showing the yield curve during the Great Depression (the red line is long term rates, the green line is short term rates. You can ignore the other two lines):


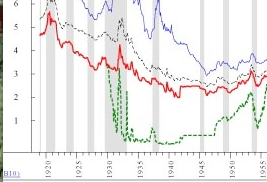
While the curve was inverted in 1928 (an inverted yield curve in the presence of deflation has only happened twice - in 1928 and in 2007), presaging the beginning of the GD downturn, it reverted to a positive slope for the remainder of the 1930s, and in particular the 1930-32 period.

Similarly, the positive slope of the yield curve beginning in late 2007 did not foretell a respite or recovery in late 2008 -- quite the contrary, by then deflation had taken hold, and so the curve was of no help. When deflation began to abate in 2009, and specifically when year-over-year deflation began to improve at midyear, the yield curve did accurately foretell the expansion of the second half. In the graph below, the black line is the curve from one year ago, and the red line is from the end of December several weeks ago. Note that in both cases, the 30 year bond yields more than the 10 year bond, yields more than short term bonds. That is a positive yield curve.


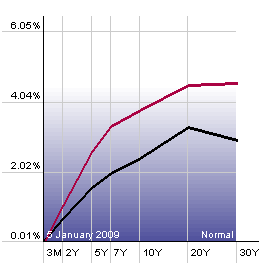
I call this the K.I.S.S. indicator. If you look at only one indicator and nothing else, this is the one to observe. Needless to say, the strongly positive yield curve now foretells strong economic growth throughout the entirety of next year - provided there is no deflation. More on that in part IV below.

III. About the "Blip"

First, a brief but necessary digression. As I indicated above, both Prof. Paul Krugman and Calculated Risk are calling the likely good GDP reading that we are about to see a "blip" that can be attributed to inventory restocking. The implication for the blogosphere being, of course, that it will momentarily pass and we will be back in negative GDP pronto, even though that is not what either are saying. Krugman thinks the odds against. a double-dip are 60%- 70%. CR sees 1% to 2% growth. Their template is the temporary bounce following the 1980 recession which promptly resolved into the very deep 1981-1982 recession. I agree that GDP is likely to subside, but disagree with the analogy.

In the first place, as I've already shown, Prof. Krugman has a long history of forecasting recessions year after year after year. While he is right to remind us that inventory bounces can be transitory, that doesn't mean a return to recession. The need for strong inventory restocking now is simply the reverse of the complete halt in inventory stocking that took place following the Black September 2008 financial panic. As the Wall Street Journal put it last July:
The rapid pace at which businesses shed jobs during the recession comes with a flip side: Workers will need to be hired back quickly as the economy improves.....

"Firms were unusually aggressive in cutting costs and cutting employment," said James O'Sullivan, an economist with UBS. "The flip side of that remains to be seen, but it could mean that companies will be quicker to bring back people because they were more aggressive about getting rid of them."

Businesses say they are running lean....

In other words, any positive "blip" now is simply the reversal of the negative "blip" in inventory depletion that caused -6% annualized GDP a year ago. It does not stand alone and does not thereby portend Doom afterwards.

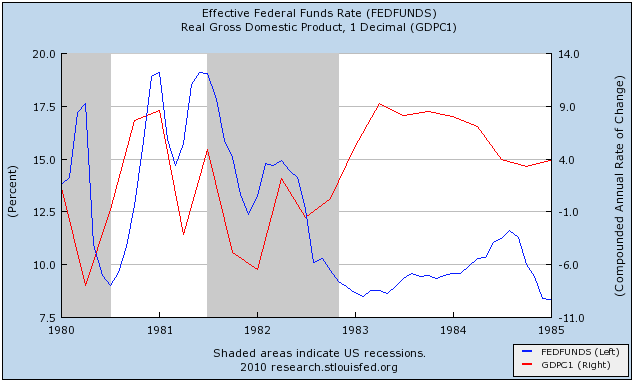
Secondly, the double-dip after the 1980 recession has a very simple and straightforward explanation: Paul Volker of the Fed raised the Federal Funds rate from 9% ti 19% in 6 months, effectively killing the economy and employment in order to kill inflation. Here's two graphs showing it. In the first, the Fed Funds rate is in blue, and the GDP in red:


In the second, the same Fed Funds information is in blue, and jobs are in green:


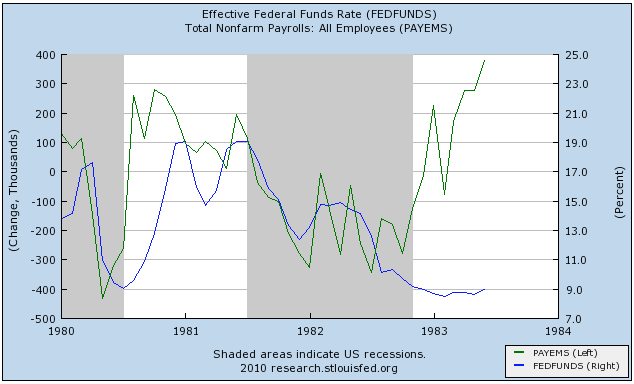
Like I said, the Fed doubled interest rates and killed both GDP and employment. Unless the Fed does the same sort of thing in the next couple of months, a repeat performance is very unlikely. It's true that inventory restocking will enhance GDP readings, but that is commonplace at the beginning of economic expansions. Take a look at this graph of annualized GDP growth from 1980 to the present:


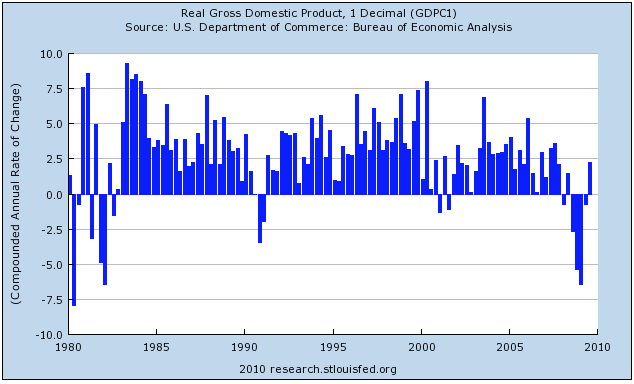
The graph shows Krugman's exemplar "blip", but notice what happens after 1982 -- there is a full year of +7.5% GDP growth from early 1983 to early 1984, that slowly tails off thereafter. Contrast this with the lackluster GDP growth of under 3% in the first 3 or more quarters after the end of the 1991 and 2001 recessions. The quick growth of Industrial Production of the last 6 months shows that this economic expansion has much more in common with the 1983 expansion than the 1992 and 2002 ones. Yes,strongly positive GDP will subside as inventory restocking fades, but that by no means foretells a double-dip.

IV. The Joker in the Deck: Oil

If the leading economic indicators are telling us that the first half of the year is likely to be good, and the K.I.S.S. yield curve indicator says the second half as well, are we home free?

Unfortunately, no. Remember that the Achilles' heel of the yield curve as a forecasting tool is the onset of deflation. That is exactly what happened in the second half of 2008 -- and it was all because of Oil. Once Oil hit about $3/gallon, it started to seriously impact consumers' wallets. It rose as high as $147/barrel before falling to about $35/barrel in December 2008, causing the most serious deflationary bust since 1938. Here's what happened to the price of Oil in 2009:


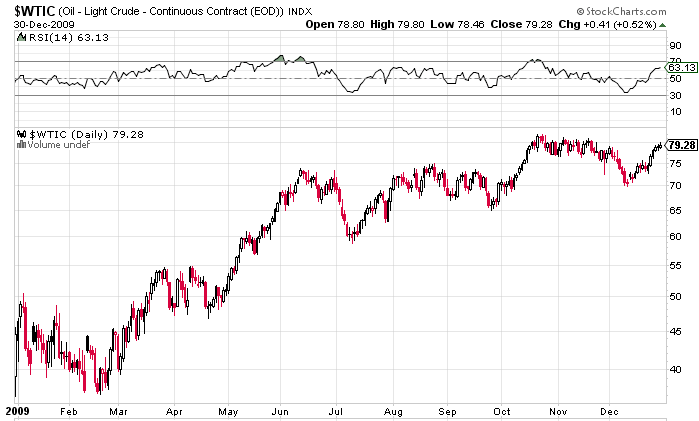
It is disconcerting to say the least that only 2 quarters into an economic expansion following the most serious destruction of consumer demand in over half a century, Oil is already over $80/barrel. There is a very distinct whiff of the speculative boom in Oil prices of 2007 and early 2008 taking place now. Generally, we can average the top and bottom prices from 2008 at about $90 a barrel, and predict that the more Oil goes over $90 a barrel, the more it will collapse under $90 a barrel in the ensuing downturn caused by the Oil price shock.

To show you what I mean, here is a chart of the last 10 years of BLS consumer price monthly data, unadjusted:


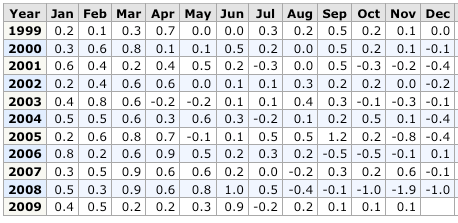
You can see that there is a marked seasonality in inflation. It tends to increase in the early part of the year, and decrease in autumn. That has a great deal to do with Oil. As spring and summer driving picks up, the price of gas increases. As driving wanes towards the end of the year, gas prices tend to decrease.

Now here is the same chart with the seasonal adjustments added in:


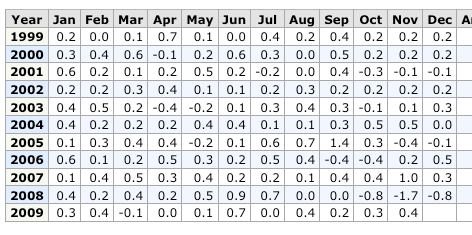
Note that there were 5 incidents of deflation longer than one month shown in this graph: late 2001, early 2003, late 2005, late 2006, and a very serious bout of deflation in the second half of 2008. The first four were not long or deep enough to show up as a serious impact on the economy. The last one, however, exactly coincided with the Panic of 2008. In this regard, it is important to remember that the "Panic of 2008" consisted of two parts: while the part we remember the most now was the "Black September" collapse of banking, lending, and buying, in fact the first part was an Oil-shock induced recession that featured gasoline over $3/gallon for the first two-thirds of the year, going over $4 in June and July.

In summary, if consumers once again have to pay over $3 a gallon for gas (which ~$90 Oil would give us), it will have a psychological as well as economic impact on consumers, and I would expect them to cut back in other areas. This looks likely to be the case. We are just 6 months into renewed economic expansion, and at the seasonal low for Oil prices, and already Oil is at $80 a barrel. It is a near certainty that the expansion will continue for at least 3-6 more months. Does anyone see any reason for Oil prices to decline in that period? Of course it could happen, but it doesn't seem likely. It seems much more likely that Oil prices will continue to increase, but slowly this time as opposed to the skyrocketing speculative blowoff that led to $147 Oil in July 2008.

Whether $90+ Oil will lead to a full-blown double-dip economic contraction, or just a slowdown later in the year, is almost impossible to gauge. It depends upon how far over $90 Oil shoots, and how long it stays there. If there is a dramatic overshooting a la 2007, there will be a double-dip. If there is a gradual increase over $90 that does not last that long before consumers cut back and the feedback loop causes price declines, then there may just be a slowdown, or if there is a contraction, it may be shallow and only last a quarter or two -- which is my best guess, and only a guess, at this point.

V. The Gilded Recovery

Even if economic growth continues throughout the year, and even if there is an improvement in the number of jobs in the economy, any such recovery will still reflect deep structural problems. In short, if it doesn't feel much like an expansion to you, that's probably because you're not among the top 10% income recipients. This economic recovery is truly a Gilded one, where the wealthy have outlooks so separate from average Americans that we may as well be in two countries. Last September, the American Affluence Research Center Survey found that:
America's most affluent consumers have a negative opinion of current business conditions but possess a positive 12 -month outlook for improvements in business conditions and the stock market....

The survey was conducted in September [2009]-among 684 respondents representative of the wealthiest 10% of Americans -some 11.2 million households, accounting for about half of total consumer spending. It also reveals that spending plans over the next 12 months have improved since the previous study, in the spring, but continue to be soft in comparison to prior-year reports in the eight-year series of surveys.

The same poll found the following, according to Lakshman Achuthan:

You are going to see broad consumer consumption numbers continue to grow. Part of that will be accompanied by jobs growth. This is already happening.

Underlying that, though, is literally a tale of two worlds.

If you have a job and didn’t lose it during this recession, then you are looking around and you have pent-up demand. Prices are lower across the board, noticeably so. That combination means you are going to consume a bit.

If you don’t have a job, you’re not going to do that.

.... If you are earning over $100,000, then your plans are to spend over 50% more than last year. That’s stunning. Equally stunning was that if you are making less than $30,000, then you are going to cut your spending by a third.

In a related backdrop, the wealthiest consumers, say those in the top decile of earnings and net worth – and this is not something new – account for almost half of all spending. The lower 90% account for the other half.

Lakshman Achuthan, quoted above, is a managing director of the Economic Cycle Research Institute (ECRI), who distinguished themselves last spring, in the teeth of the fiercest part of the Great Recession, by a table-pounding call that expansion was going to start in the second half of 2009. If that breathtakingly correct call wasn't enough, in August he said that the economy would start to add service jobs but not manufacturing improve by end of 2009 -- a call that was exactly accurate, as the 80%+ part of the economy that is in servies, bottomed in October and started to add jobs in November:


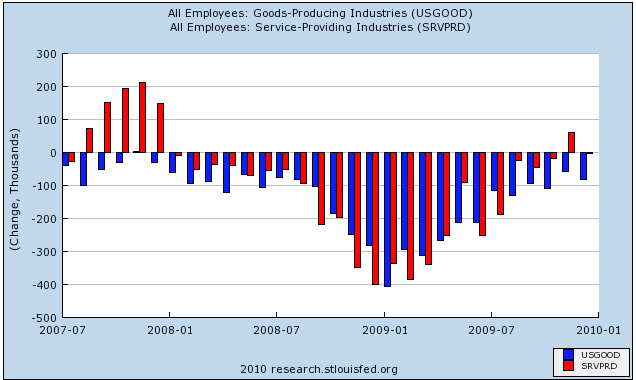
(service jobs are red, goods-producing jobs are blue in the graph above).

So I am paying a lot of attention to him.

But listen to what he says about the longer term:

He sees a resiliant economic recovery, with the job numbers turning positive within the next few months. But he doubts that the upturn will last long enough to put America back to work. Only some of the 7 million lost jobs will be recovered before the next recession strikes. The Teens could well be a decade of more frequent recessions with shorter recoveries in between. That implies chronically high unemployment for years to come.

Ever since World War II, each upturn has been a bit slower than the one before, with the post-2002 upturn the weakest on record. Lakshman’s forecast assumes that that pattern continues. As for the length of the current recovery, everything depends on when the Fed starts raising interest rates. Too soon, and the economy sinks immediately. Too late, and inflation takes hold, which would force even higher rates and a sharper downturn. Even if the Fed gets its decision just right, and the economy keeps coasting along, it won’t gain enough strength to reduce unemployment significantly.

And elsewhere he has said:

[T]he pace of growth of the US economy during each expansion has been falling for decades. In you combine lower trend growth expansion with higher cyclical volatility, it dictates more frequent recessions. Japan, with a 1% GDP trend growth rate for the last 20 years, has seen four recessions, about one every five years. On the other hand, China, with roughly a 10% GDP trend growth rate, has seen zero recessions in the last 20 years.

That really illustrates the points I am making. Regardless of all the hand waving, those are the hard facts. Our trend growth rate is getting lower and our cycles are getting shorter and more volatile. We only have to look to the second largest economy in the world, which is Japan, to see that that adds up to more frequent recessions.

As others have noted here and elsewhere, in the last twenty years our economy seems to have lived off of one asset bubble after another, each one requiring lower and lower interest rates, and each one requiring more and more pump priming by the Treasury, as the middle class has gradually been hollowed out and gone deeper and deeper into debt. For the consumer and the Fed, that trend is now at its end. Only increased debt issuance by the Treasury, or simply issuing money, is left. That the chief beneficiaries of this largesse have been the very plutocratic entities which enabled the current disaster only exacerbates the problem, as they take that largesse and invest in commodities like -- Oil -- thereby causing its price to rise, acting like a choke collar on economic growth. What Achuthan sees in the long term GDP trends, I see in the long term travails of average Americans. I believe he will be proven right. There will be no long lasting widespread economic growth until the structural issues in the economy are dealt with.

IN CONCLUSION, 2010 looks like it will be a year very much in two halves. The first half will feature growth, and much stronger growth than most anticipate. Depending upon the behavior of Oil, the second half may just show us somewhat more tepid growth or by the fourth quarter there may actually be some contraction, although there is no sign whatsoever at this point at least of a repeat of "cliff-diving."

But even if so, the structural problems behind the economic malaise of average Americans have been completely unaddressed. LIke a drug user, the US economy requires more and more financial narcotic to achieve the same effect, and as a result expansions and recoveries will become shallower and shorter, and recessions deeper, more frequent, and /or longer, until those issues are addressed.

Market Mondays


A.) Have the IWCs formed a double top?


A.) The SPYs have broken through the top channel line on higher volume. They have also broken through the 10 day EMA and are currently at important support levels.


A.) The transports have not followed the averages higher. Instead, they have been moving sideways with no strong trend either way. However, on Friday they also broke their upward trend on strong volume.


A.) The IWMs broke their uptrend which has now become upside resistance. Prices currently stand at technical support levels. Prices sold-off on higher volume on Friday.


A.) The QQQQs have run into upside resistance at the ~$46.50 level six times in the last 10 days. That indicates there is incredibly strong supply at that level.