Friday, December 18, 2009

Weekend Weimar and Beagle

It's that time of the week. We'll be back Monday for a Holiday shortened week.

Until then ....


Weekly Indicators

- by New Deal democrat

Virtually all of the monthly and weekly data points reported this week indicated continued economic expansion. Both the PPI and CPI explicitly turned from YoY deflation to inflation, showing pricing power. Housing permits and starts rebounded strongly from last month's surprise decline (probably a one-off result of an anticipated ending of the $8000 housing credit). Industrial production and capacity utilization rose strongly, while the New York and Philly Fed regional reports for December were contradictory, one nearly tipping into contraction and the other showing expansion at an increasing rate. November Leading Indicators were reported at +0.9, indicating economic growth will probably continue right through the first quarter of next year.

Turning to the high-frequency weekly data:

Weekly sales at retail chains
rebounded slightly, rising 0.4% [pdf] for the week ending December 12, 2009, and 2.4% on a YoY basis.

Shoppertrak likewise said sales rose 1.1% on a YoY basis, and 18.2% percent from the previous week, completely erasing that post-Black Friday downturn.

The BLS reported that initial jobless claims were up 7000 last week to 480,000, but the 4 week moving average continued to decline.

Gasoline usage last week remained steady at a rate slightly above last year's, while the average cost of a gallon of gas dropped out of its 8 week range, to $1.59.

Halfway through the month, on the 16th the Daily Treasury Statement showed $79.8B paid in withholding taxes, compared with $84.2B on the same day last year, indicating that the distress of state and local governments in particular is intensifying and has not yet started to reverse.

Finally, the Railfax report for last week showed that cyclical traffic was almost exactly that of a year ago. Intermodal traffic is not far behind. The only types of cargo not greater than their shipments a year ago are coal and forest products. All divisions of traffic have finally begun their seasonal decline, but cyclical traffic in particular has been quite steady over the last three months, a continuing good sign. Last week a representative of Railfax commented here that "We break the data into three distinct categories that should be viewed independently. Then the data can be used as a proxy for the manufacturing economy (cyclical), imports (intermodal) and electrical production (baseline). And you can always call us with your questions."

In summary, this week showed a continuing substantial economic expansion, with slightly easing weakness in the labor market.

Philadelphia Fed Increases

The Philadelphia Federal Reserve's Manufacturing survey increased this from from 16.7 to 20.4.

Here's a chart of the data:


Click for a larger image.

Note the number has increased for most of the year, rising from a reading a ~(-40) to it's current reading of 20. However, also note that on the future expectation's chart we see a decline in the future expectation's index. However, note we saw a similar pattern after the last recession when optimism jumped at the beginning of the expansion but waned throughout the recovery. This time we are seeing that decrease happen quickly which is a concern.

Also of note: the employment index showed net hiring for the first time since late 2007.

Unemployment Drops in 36 States; Remains Unchanged in 8

From the BLS:

Regional and state unemployment rates were generally lower in November.
Thirty-six states and the District of Columbia recorded over-the-month unemployment rate decreases, 8 states registered rate increases, and 6 states had no rate change, the U.S. Bureau of Labor Statistics reported today. Over the year, jobless rates increased in all 50 states and the District of Columbia. The national unemployment rate edged down in November to 10.0 percent, 0.2 percentage point lower than October, but3.2 points higher than November 2008.

In November, nonfarm payroll employment increased in 19 states and decreased in 31 states and the District of Columbia. The largest over-the-month increase in employment occurred in Texas (+17,300), followed by Ohio (+5,400), Georgia (+4,800), and Arizona and Iowa (+4,300 each) Alaska experienced the largest over-the-month percentage increase in employment (+0.5 percent), followed by Iowa (+0.3 percent). The largest over-the-month decrease in employment occurred in Florida (-16,700), followed by Michigan (-14,000), California and Pennsylvania (-10,200 each), and New Jersey (-9,400). Hawaii (-1.0 percent) experienced the largest over-the-month percentage decrease in employment, followed by Nevada (-0.7 percent) and Maine, Mississippi, and Montana (-0.6 percent each). Over the year, nonfarm employment decreased in all 50 states and increased in the District of Columbia. The largest over-the-year percentage decreases occurred in Nevada (-6.1 percent), Wyoming (-6.0
percent), Michigan (-5.9 percent), Arizona (-5.6 percent), and Oregon
(-5.2 percent).


Because this is good economic news it is an inherently flawed report that is nothing more than government propaganda. If it was bad news, then the numbers would be sacrosanct.

Thanks to NDD for the email on this...

Gold Retreats


Click for a larger image.

A.) Prices have retreated from their high. They are currently standing at the 50 day EMA and important Fibonacci levels.

B.) Momentum has decreased but

C.) We're not seeing a huge flight volume wise out of the market. That would make this sell-off the beginning of a correction rather than a change in trend.

Forex Fridays


Click for a larger image

A.) Prices are in a clear uptrend now and have moved through key areas of resistance. Yesterday prices printed a strong and solid bar.

B.) The EMA picture is turning bullish. All the EMAs are moving higher, the 10 day EMA has moved through the 50 day EMA and the 20 is about to. In addition, prices are above the EMAs

C.) The relative strength is increasing, indicating prices are getting stronger relative to other prices

D.) Momentum is increasing as well.


A.) Prices have broken through the upper trend line that contained prices.

B.) prices are getting stronger

C.) The MACD has given a buy signal.

The daily and weekly charts have lined up to give a combined buy signal. The question is why? What is the (if any) fundamental reason for this change?

Thursday, December 17, 2009

Today's Market


Click for a larger image.

This is a chart for the Russell micro-cap index.

A.) Although prices have broken through top-side resistance, they have made little gains. That is troubling, especially when

B.) Momentum is clearly on the bulls side and

C.) Money is flowing into the market.

The New Consumer

Barron's originally dealt with this back in June:

As savings rise and the market rallies, however, a new consumer is emerging, seeking a sensible middle ground between the gross excesses of the mid-2000s and the privations of the past year. He -- and more often, she -- is likely to find it in companies that offer great products, excellent service and outstanding value, which, by the way, doesn't always mean the lowest price.


Now the WSJ weighs in:

The economy appears to have begun recovering after the worst recession in half a century. But businesses ranging from shoemakers to financial services to luxury hotels don't expect American consumers to return to their spendthrift ways anytime soon. They see consumers emerging from the punishing downturn with a new mind-set: careful, practical, more socially conscious and embarrassed by flashy shows of wealth.

Much as the 1930s shaped the spending habits of an entire generation, many companies now anticipate a shift in consumer behavior that persists even after jobs and growth get back closer to normal.

"We seem to be at a cultural inflection point that we haven't seen since World War II," said Jim Taylor, vice chairman of market researcher the Harrison Group. Last month it surveyed 1,800 affluent Americans and found that 48% think they could suffer major financial losses in the future. "People are getting used to being careful, and I don't know how you undo that," Mr. Taylor said.

This ties in to a few interesting developments.


Total household debt outstanding is decreasing. Therefore


Debt service payments as a percentage of disposable income are decreasing. In addition


The financial services obligation ratio is also dropping. In addition,


The savings rate is increasing, indicating we're spending less.

So, we're paying down debt and becoming thriftier. We're becoming our parents.

FOMC Statement

From the Federal Reserve:

Information received since the Federal Open Market Committee met in November suggests that economic activity has continued to pick up and that the deterioration in the labor market is abating. The housing sector has shown some signs of improvement over recent months. Household spending appears to be expanding at a moderate rate, though it remains constrained by a weak labor market, modest income growth, lower housing wealth, and tight credit. Businesses are still cutting back on fixed investment, though at a slower pace, and remain reluctant to add to payrolls; they continue to make progress in bringing inventory stocks into better alignment with sales. Financial market conditions have become more supportive of economic growth. Although economic activity is likely to remain weak for a time, the Committee anticipates that policy actions to stabilize financial markets and institutions, fiscal and monetary stimulus, and market forces will contribute to a strengthening of economic growth and a gradual return to higher levels of resource utilization in a context of price stability.


Let's look at some of the charts to get a better idea of what the Fed sees. As always, click on each image for a larger image.


Existing home sales have been picking up for most of the year as have


New homes sales (h/t Calculated Risk).


Real retail sales have bottomed. Note: I originally used the non-inflation adjusted chart for this. Sorry for the mistake.


Real PCEs are increasing, although weakly.


Real private fixed investment has been flat for the last ~6 months.


Initial unemployment claims are dropping. That tells us that the rate of job losses continues to deteriorate. In addition,


The rate of establishment job losses continues to moderate as well.

Bottom line -- and I've been saying for about 7-9 months now -- the economy is stabilizing and in some cases improving. It's not the greatest expansion we've ever seen, but considering where we were it's about what we should expect.

The Committee will maintain the target range for the federal funds rate at 0 to 1/4 percent and continues to anticipate that economic conditions, including low rates of resource utilization, subdued inflation trends, and stable inflation expectations, are likely to warrant exceptionally low levels of the federal funds rate for an extended period.


BUT .. the Fed is not expecting a strong economy (and they shouldn't) so they're keeping things easy for now.

Initial Jobless Claims: 480,000; Nov. LEI +0.9

- by New Deal democrat

The BLS reported that for the week ending December 12, seasonally adjusted initial jobless claims were 480,000, up 7,000 from last week's slightly revised 473,000.

The 4-week moving average is now 467,500, compared with 472,750 last week. The 4 week seasonally adjusted moving average is now about 29% lower than the peak of 658,750 on April 3 of this year. (During the last two "jobless recoveries", new claims never declined anywhere near 29% from peak).

Unadjusted, there were 555,344 new claims, a decrease of 107,393 from the week before, showing how much seasonal volatility exists in the weekly numbers at this time of year. Today's reading is well below the 626,867 initial claims in the same week last year.

This week's initial jobless claims number is the "Big One," because last week (the week being reported on) was the week during which the BLS made its December jobs survey. Here's the relationship between the initial jobless claims number in the reference week (left) and the monthly jobs number (right) since ther peak in Initial Jobless Claims at the beginning of April:

2009-04-01 (+648) (-519)
2009-05-01 (+630) (-303)
2009-06-01 (+617) (-463)
2009-07-01 (+567) (-304)
2009-08-01 (+571) (-154)
2009-09-01 (+564) (-139)
2009-10-01 (+532) (-111)
2009-11-01 (+513) (- 11)
2998-12-01 (+480) ????

In summary, based on my prior research, initial jobless claims are suggesting that actual job growth is taking place in the economy this month.

From Bonddad -- here's the chart:


Notice the 4-week moving average continues to move lower. This tells us the overall trend is in place.
-----------
UPDATE: November LEI were reported at +0.9. October's stayed at +0.3 (housing permits didn't add or subtract as much as I thought). This means that in the last 8 months, the LEI are up +6.8. YoY LEI are up +5.7. This is also very consistent with the YoY readings during the last two recoveries when jobs were finally added to the economy.

Thursday Oil-Market Round-Up


A.) Oil prices broke through the lower end of their trading range last week and sold-off. Note that withing the sell-off we have a large gap down and a strong downward sloping bar.

B.) Prices rebounded yesterday, printing a large upwardly moving candle.

C.) Despite yesterday's move, momentum is still downward.

D.) Notice that money is flowing out of the oil market in the latest sell-off.

I should add that the EMA picture is negative. Prices are now below the 200 day EMA, the shorter EMAs are below the longer EMAs and all the EMAs are moving lower.

Wednesday, December 16, 2009

Today's Market

I've been commenting a lot lately about how the market has stalled. Corey over at Afraid to Trade offers a great explanation as to why.

Housing Permits & Starts and Oct./Nov. LEI

This morning's release of Housing Permits and Starts is cause for a big sigh of relief. Permits, which had dropped from 575,000 in September (their high water mark for the year) to 552,000 in October, rebounded to 584,000 in November. Similarly, Starts, which also plummeted from 592,000 to 529,000 in October, rebounded to 574,000.

Aside from confirming that October's nasty surprise was a one-off event linked to the expiration of the $8000 housing credit program, this rebound also means that the fundamental increase in the Leading Economic Indicators has not been disturbed. Earlier I estimated that October revisions plus November indicators would probably net ~+0.3. That remains true. Since I believe October may get revised down ~0.4, this means that October's LEI may be revised to -0.1 -- but on the other hand, November's LEI will probably come in at ~+0.7.

Producer Prices Increase 1.8%; CPI Increases .4%

From the BLS:


The Producer Price Index for Finished Goods rose 1.8 percent in November, seasonally adjusted, the U.S. Bureau of Labor Statistics reported today. This increase followed a 0.3-percent advance in October and a 0.6-percent decrease in September. In November, at the earlier stages of processing, prices received by manufacturers of intermediate goods climbed 1.4 percent, and the crude goods index rose 5.7 percent. On an unadjusted basis, prices for finished goods moved up 2.4 percent for the 12 months ended November 2009, their first 12-month increase since November 2008.

About three-fourths of the November advance in the finished goods index can be traced to higher prices for energy goods, which jumped 6.9 percent. The indexes for finished goods less foods and energy and for finished consumer foods also contributed to the finished goods increase, both rising 0.5 percent.


Note that energy prices are currently decreasing. Should that trend continue I would expect a lower number next month. In addition, consider this chart of data from the same report:


Click for a larger image

Notice that producer prices have had two other large increases over the last 6 months, both largely caused by energy prices. Producer Prices dropped back down the next month on a decrease in energy prices. The "jumping around" effect is shown really well in the following chart:


Finally on PPI we have this year over year chart:


The fears of deflation are probably close to being extinguished at this point with the year over year increase.

From the BLS:

On a seasonally adjusted basis, the Consumer Price Index for All Urban Consumers (CPI-U) rose 0.4 percent in November, the U.S. Bureau of Labor Statistics reported today. Over the last 12 months the index increased 1.8 percent before seasonal adjustment, the first positive 12-month change since February 2009.

The seasonally adjusted increase in the all items index was due to a 4.1 percent increase in the energy index. The index for gasoline rose sharply and the indexes for electricity, fuel oil, and natural gas also increased, creating the fourth consecutive rise in the energy index and the largest increase since August. In contrast, the index for all items less food and energy was unchanged in November, after ten consecutive monthly increases. Declines in shelter indexes offset increases in the indexes for new and used motor vehicles, medical care, airline fares, and tobacco.


Let's look at the data from the report.


First, we've had increases in 8 of the past 12 months. That is actually good news because it indicates we're probably clear of a deflationary threat. In the long-run that is very good news.


Notice the year over year number is now back in positive territory. This is the same pattern the PPI followed and it is also good news largely because it means we're probably clear of a deflationary threat.


Click for a larger image.

The primary reason for this month's increase was energy prices -- just like PPI.
-----
NDD here, adding the following:

The same factors apply to the CPI as to the PPI. In short, it’s all about Oil – correlating with the run-up in Oil from $70 to $80/barrel.

Note that at the moment Oil is back down to $70/barrel which suggests that December may take back all of the November increase. In short, there are no real inflation concerns in the consumer number.

1.8% inflation with a ZIRP by the Fed = EZ money! And that means economic growth in the immediate future. If anything, the fact that YoY core inflation continues to be very low – only 1.7% again this month – is cause for concern in that there is very little cushion between here and institutionalized deflation (see Prof. Krugman re: this). The more present problem is that YoY PPI at 2.7% is higher than YoY CPI at 1.8%. If that is just a one month blip, it’s not a big deal. But if it continues, that means that producers are unable to pass on commodity price increases to already-strapped consumers, and that in turn is a recipe for yet another retrenchment in hiring and production.

Back over to Bonddad:
------

I would disagree regarding institutionalized deflation, largely based on the trajectory the year over year PPI and CPI have taken over the last 12 months. Both moved into negative territory and just now become positive. I think both are moving in the right direction and will continue to do so.

In summary, the jump in both producer and consumer prices was caused by energy prices which are currently declining. In other words, I think we're out of the woods for now.

Dennis Gartman: Partisan Hack

I have long respected Dennis Gartman and read his work whenever I can get my hands on it. I don't always agree with him, but he's always insightful and interesting.

Sadly, he showed his true partisan colors yesterday on Bloomberg TV when he reiterated -- at least three times -- that the cause of our recent economic near-death experience was "the government forcing banks to make loans to people who never should have gotten them in the first place" (e.g. The CRA made me do it). That canard has been discredited so many times, for so long, by so many people -- including members of the Fed and bank execs themselves -- that I couldn't even believe Gartman was going to try to breathe life into it. But there he was.

Sorry, Dennis, I think many folks lost a great deal of respect for you yesterday. I know I did. Credible pundits should take better care to separate their politics from their economic analysis. The two don't belong together.

Cites:

Federal Reserve: "In the end, our analysis on balance runs counter to the contention that the CRA contributed in any substantive way to the current crisis."

Ken Lewis, BofA CEO: "But the charge that CRA lending was the primary or foundational cause of our housing crisis is not only unfair, it’s not true. [...] There’s no mandate to make risky loans, or to abandon sound lending principles. [...] Many reports and investigations, including a Fed report in 2000 and our own experience over the past 30 years, have found that CRA lending can be profitable, and need not be overly risky. The riskiest subprime lending of the past ten years didn’t have anything to do with CRA… in fact, 75% of high-priced loans made by mortgage companies and bank affiliates in recent years were not covered by CRA."

Literally dozens of others all over the web.

From Bonddad: This is one of the basic problems with the US: pure stupidity and a need to explain everything through a partisan lens. The causes of the financial wreckage of 2008 were numerous. In essence, to understand them you have to be aware of how multiple events can play out. This requires thinking beyond labels and talking points. That is not possible in today's political environment.

Wednesday Commodities Round-Up


Click for a larger image.

Notice the overall trend of natural gas has been down for some time -- as in months. However


We may be seeing the bottom of the trend.

A.) Prices have clearly reversed. They have moved though all the EMAs and are now above them all. Also notice the 10 and 20 day EMAs are rising and the 10 day EMA has moved through the 20 day EMA.

B.) Momentum is increasing. However,

C.) We've not seeing a big move in the A/D line, indicating we have yet to see a big influx of capital into the market.

However,


Note that on four other occasions this year prices have been at this level only to be rebuffed.

Tuesday, December 15, 2009

Today's Market


Note the last four days we've seen some incredibly poor candles -- narrow bodies with long shadows. Also note that prices have had an incredibly difficult time getting over the 111-112 area. Finally, volume isn't that strong.

The EMA picture is still positive -- all are rising and the shorter are above the longer.

Overall, I'm still not happy with the market.

Flow Of Funds Debt Section

In the previous post on the household balance sheet, we saw a drop in household liabilities. Let's take a deeper look at that trend. As always, click on an image for a larger image


Note the first really large drop in household debt acquisition was in 2008 when we saw an annual increase of only .3%. The 6.7% increase in 2007 was still in line the annual percentage increases in the 1990s.


We see that by the second quarter of 2008, the quarter to quarter percentage change was barely positive. Since then it has been negative. This chart directly tracks the two primary components: mortgage and consumer debt.


Household mortgage debt growth went negative in the second quarter of 2008,


But non-mortgage debt's percentage increase went negative in the fourth quarter of 2008.

This information tells us the US consumer is now shedding debt. This is consistent with the contraction we have been seeing in consumer credit. It bodes well for the future because household debt reached incredibly high proportions during the last expansion.

Flow of Funds Shows Further Stabilization

On December 10, the Federal Reserve released the Flow of Funds report. This is one of the best documents for understanding the US economy. It simply shows how money is flowing through the economy. It is 120+ pages of pure econo - geek heaven.

First, let's look at households balance sheets. In the charts below, the overall trend is clear: starting with the second quarter of 2008 we say a deterioration of households overall balance sheet. However, for the last two quarters we have seen stabilization. As always, click on all charts for a larger image


Overall net worth has increased for the last two quarters. This is the result of


An increase in the value of total assets and


With the exception of the third quarter of 2008, as decrease in overall liabilities.

On the asset side, we see that


Real estate values have increased. This adds further evidence to the argument that the real estate market has bottomed. In addition,


Total financial assets have also increased.

So -- we have things moving in the right direction. Overall liabilities are down and assets are up. In addition, we are seeing an increase in several asset classes rather than one.

Industry in V-shaped "fits and starts" expansion

- by New Deal democrat

The Federal Reserve reported this morning that
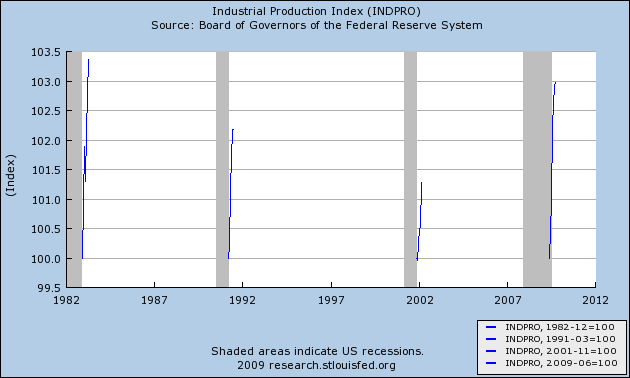
Industrial production increased 0.8 percent in November after having been unchanged in October.
Manufacturing production advanced 1.1 percent, with broad-based gains among both durables and nondurables. The output of mines climbed 2.1 percent, but the index for utilities fell 1.8 percent, primarily as a result of lower output of gas utilities--temperatures in November were unseasonably mild and reduced the need for heating. At 99.4 percent of its 2002 average, total industrial production was 5.1 percent below its level of a year earlier. Capacity utilization for total industry moved up 0.7 percentage point to 71.3 percent, a rate 9.6 percentage points below its average for the period from 1972 through 2008.


From Bonddad: here are some charts from the report:


Notice we've been increasing for a few months. This is good. In addition,


Click for a larger image

Capacity utilization is increasing as well. While we still have a long way to go with both of these numbers, today's numbers are encouraging.

Taking into account the October revisions, these reports were right in line with estimates. Since bottoming in June, Industrial Production is up 3.6% for an annual rate of 8.7%. This is the best rate of expansion off a recession bottom since 1982, and far exceeds the 1992 and 2002 "jobless recoveries," as indicated in this graph (which does not include this morning's data):


Industrial production and capacity utilization are not the only items producing a "V" shaped industrial recovery. Average hours in manufacturing are up more strongly from the bottom than at any time since 1982:

as are hours of overtime in industry:


In large part, the V-shaped industrial recovery so far can be laid at the feet of the auto industry, which has increased sales by almost 2 million at an annual rate (from just over 9 million to just under 11 million), although this is only about 1/3 of the way back to the pre-recession level of vehicles sold:


You may recall that Industrial Production is one of 4 data series I am tracking in an effort to forecast when job growth will occur. This data is actually for last month, in which the household survey showed growth, but the payrolls survey was just barely negative at -11,000 (subject to revisions). On Thursday we will get the Big initial claims number, and also be able to calculate real retail sales. Based on the big upside surprise in PPI this morning (almost entirely due to Oil), the CPI is likely to come in "hot" as well.
-----

If Industrial Production and Capacity Utilization came in showing robust growth, then this morning's Empire State survey, showing the barest of growth in the NYC area, is a big disappointment:

The Empire State Manufacturing Survey indicates that conditions for New York manufacturers leveled off in December, following four months of improvement. The general business conditions index fell 21 points, to 2.6. The indexes for new orders and shipments posted somewhat more moderate declines but also moved close to zero. Input prices picked up a bit, as the prices paid index rebounded to roughly its November level; however, the prices received index moved further into negative territory, suggesting that price increases are not being passed along. Current employment indexes slipped back into negative territory. Future indexes remained well above zero but signaled somewhat less widespread optimism than in recent months. Indexes for expected prices paid and received declined moderately but remained well above zero.


That employment contracted is the biggest disappointment. On the other hand, these regional surveys are notoriously noisy, and we have had both upside and downside surprises from various regions in the last few months.

From Bonddad: Here is chart of the Empire State number:


That is one heck of a drop. I would add one caveats. We've had a big bounce in this number, so we could be seeing a simple "we've bought enough stuff for now" situation along with end of the year issues. However, I would call this a clear yellow flag going forward and something that needs to be watched.

End BD.

Some time ago, Bonddad described the likely course of this economic expansion as a "fits and starts" recovery, and that description seems very apt this morning.

Treasury Tuesdays


This is a chart of the IEFs (the 7-10 year Treasury market) for the last three months. Prices have revolved around the 200 day EMA, indicating that traders are still torn between bull and bear market tendencies. Over the last month a poster noted that EMAs were not the best technical indicator because markets tended to move sideways most of the time. The above chart is a good example of that tendency.


A.) Notice the large number of gaps in the chart. Trading has been pretty bumpy over the last few weeks. Also notice that most of these candles are small -- that is, the trading range for the day is pretty tight. That tells us that the volatility is coming overnight, but once trading starts it's pretty mellow.

Monday, December 14, 2009

Today's Market


Click for a larger image

Take a look at all the candles as the market traded in the $110.60 - $112 area. Lots of small bodies and long shadows. Also notice what isn't there -- long, green upwardly moving candles. The market is stalled right now. This is important especially considering the employment news we got a few weeks ago -- that should have moved the market higher. But no -- we're still here.

Paul Samuelson Dies At 94

From the WSJ:

Paul A. Samuelson, whose analytical work laid the foundation for modern economics, died Sunday. He was 94. Actively publishing into the 2000s, Mr. Samuelson’s career in economics spanned eight decades. In 1970, he was the first American to win the Nobel Prize in economics, the second year the prize was offered.


To anybody who has spent time studying economics, this is s huge loss. I still have a copy of his econ text from college (and that was over 20 years ago). It is still a great source of basic information. Here is a link to his works on Amazon.

Unemployment in the 1980s

SilverOz made a comment to a previous thread that got me thinking -- what was the 1980s like? Well -- here is a chart:


Click for a larger image.

Short version: it took about 6 years to get back to full employment in the 1980s.