Friday, April 18, 2008

Weekend Weimar and Beagle

It's that time of the week again. The markets are closed so stop thinking about them.

Here are some puppy pictures. Why? Because I'm a sucker for puppies, that's why


I'll be back on Monday. Have a safe weekend.

What Inflation?

From the WSJ:

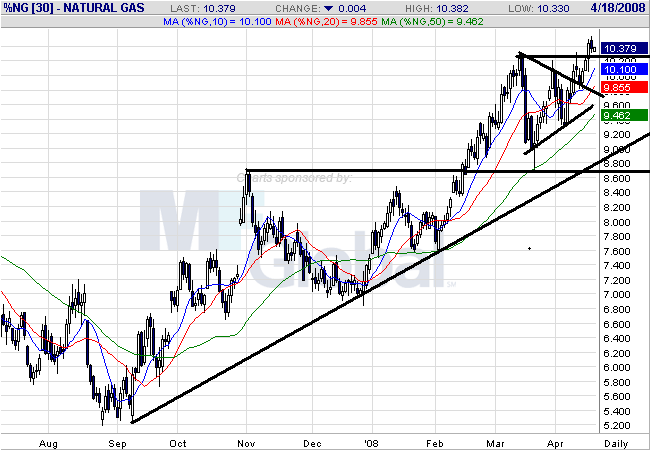
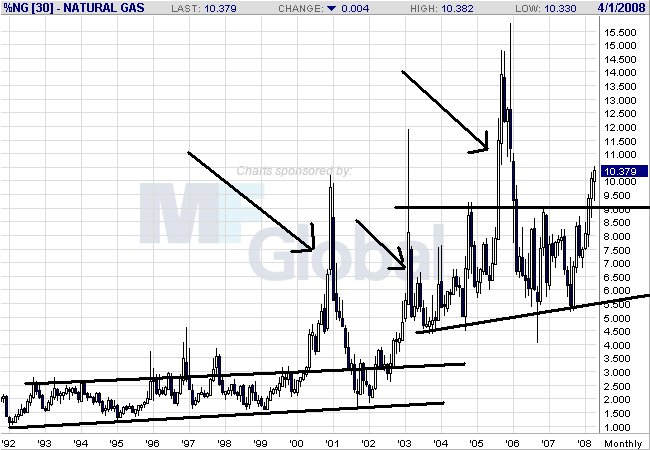
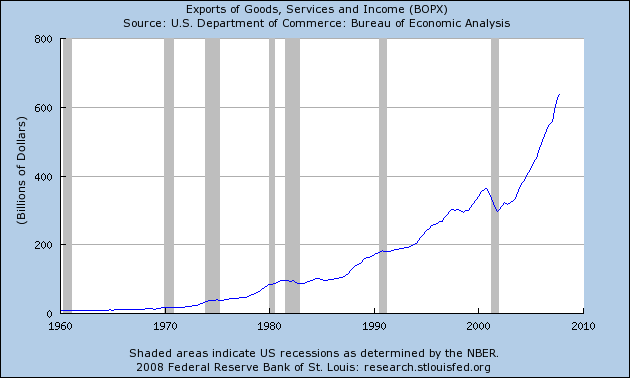
Americans feeling the pain of record gasoline prices now face the likelihood of another fuel shock, from natural gas.

Prices in the U.S. have risen 93% since late August as power-hungry nations like South Korea and Japan compete in a global natural-gas market that scarcely existed a half-decade ago. Still, U.S. prices are as low as half the level of some overseas markets, suggesting they have much further to rise.

The global appetite for natural gas has profound implications for a U.S. economy already tipping toward recession and struggling against inflation pressures. The fuel heats half of U.S. homes, generates 20% of the country's electricity and is used to make everything from fertilizer to plastic bags. In March, rising natural-gas prices contributed to a higher than expected 1.1% increase in producer prices, according to the Labor Department.

U.S. natural-gas output has actually been rising in recent months, and not everyone agrees that prices are destined to surge. However, a significant number of financial players are now betting on an increase.


Let's look at the chart to see what's going on.


The above chart shows a strong rally. Notice the following:

-- Prices have almost double since last September

-- All the SMAs are moving higher

-- Prices are above the SMAs

-- The shorter SMAs are above the longer SMAs

-- There is a strong uptrend in place


However, the multi-year chart shows the natural gas market is especially prone to price spikes. So, that's what we could be dealing with here.

The WSJ Starts to Show the Murdoch Influence

I was wondering when this would happen. The WSJ -- without a doubt one of the best papers out there and the preeminent business paper -- is falling for the Fox news influence:

Thus far, roughly 20% of the companies in the S&P 500 have reported, and overall first-quarter earnings are down 22.1%, according to Brown Brothers Harriman. But excluding financials, earnings are up by 8.2%. If the actual reported earnings are combined with estimates for the remaining companies, earnings are coming in slightly above expectations, at a 12.9% decline. Excluding financials, they're up a healthy 9.5% Brown Brothers says.


Why is this wrong?

-- The financial sector is the largest part of the S&P 500, comprising 17.64% of the index.

-- The financial sector provides the lubricant (read money in the form of credit) for the whole economy. If it isn't functioning well we have a big problem overall.

-- This is part and parcel of the "if we don't talk about it, it's not really a problem" mentality that has infested American political discourse for the last 20 years.

Here's the deal. If we were talking about a really small sector of the economy, say the Yak breeding business -- I wouldn't really care about their earnings picture. But we're talking about the largest component of the S&P 500 and the part of the economy that helps the other parts of the economy grow. Dismissing earnings misses, asset writedowns and the overall problems created by the credit crunch minimizes the actual impact of the problem. And that will eventually get us into a world of trouble.

Today's Markets

One of the annoying things about traveling is not being in front of a computer for most of the day watching the market and the news develop on a constant basis. Instead, I get to the hotel and have to figure it out by looking backwards at events. It's all just a bit weird.

Anyway, I'm going to do things a bit backwards this morning. Let's see if we are in the middle of a bear market bottom or rally. The reason why I am assuming it would be a bear market rally is the economic backdrop is not solid. We are just starting a slowdown. There has been a fair amount of debate over what the slowdown will look like. I think the best analysis (so far) comes from Mish who is arguing for an "L" shaped recession - a recession where the economy slows down and does not pick-up any growth momentum for some time. Considering housing won't even think about bottoming until the end of this year (at least) and we'll be dealing with the fallout from the credit crisis for some time as well this analysis makes the most sense. While Fed has provided a floor for both the market and the economy as a whole, so far they have demonstrated how powerless they really are -- they can't force people to lend money to one another. And so long as firms are writing down mortgage paper lowering their own asset base loan growth will be constrained.

Let's look at the charts:


This is the chart that got me thinking a bear market rally might be in the works. Notice the following:

-- The 10 and the 20 day SMA are both increasing

-- The 10 and the 20 day SMA have crossed over the 50 day SMA

-- Prices are over the 10 and the 20 day SMA

-- The shorter SMAs are above the longer SMAs

-- The one drawback to this theory is the low volume of this rally. While it's possible for a market to advance on low volume, it's a whole lot harder (thanks to an astute reader who pointed that out).


The analysis for the SPYs is the same as for the QQQQs -- down to the volume comments.

Let's look at the 6 month charts to put this action in perspective.


On the SPYs notice we may be forming a double bottom, with the first bottom occurring in mid-January and the second occurring in early March. Also note the lack of volume on this rally when compared to the previous months. 138 is a key level of the SPYs -- to be in a near market rally they index has to move convincingly through this level. But also note the strong support for the index in the 126 - 127 area. Every time the market has approached this area it has rallied indicating strong buy interest at these levels.


On the QQQQs, notice the market "bottomed" hard in late January and gently descended to a second low in early March. The market has been rallying since. But notice (again) the lack of volume. This is not an excited market.


Notice the possible double bottom figure along with the (surprise) lack of volume on the rally. The IWMS would have to move convincingly above 72 on solid volume for this to be a bear market rally.

The biggest problem going forward is the last of convincing volume for any of these indexes on their recent upswing. That tells me these are rallies that come from lack of meaningful selling rather than strong buying interest. As such, I don't see the markets moving meaningfully higher. However, with the Fed backstopping the markets I don't see a major sell-off either. Given the fact we have, I think a trading range is what's in out future for the next few months as traders try and get a sense for what's happing in the economy.

Thursday, April 17, 2008

The Basic Problem In a Nutshell

From the WSJ:

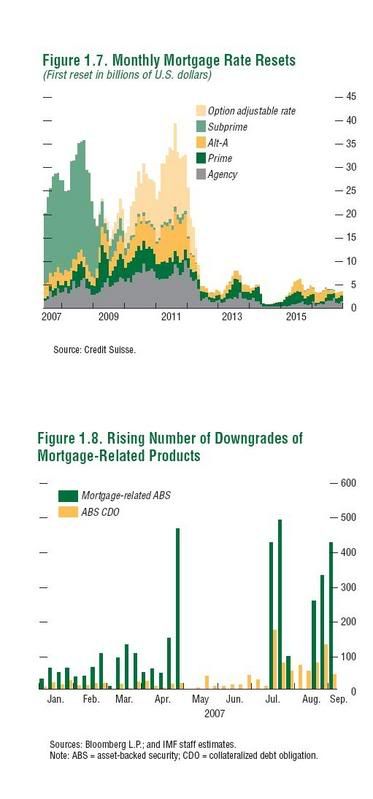
But large financial institutions have grown more cautious about lending to even highly rated companies since their capital reserves have been depleted by subprime-related bonds that have soured and loans to speculative-rated, or junk, companies that are stuck on their books. Such a curbing of lending is another worrying sign for the sagging U.S. economy since it means companies will have a more difficult time raising money during what is already a trying time.


The US -- and every other developed world financial lender -- uses a fractional reserve lending system. All this means is a bank can make loans so long as it maintains x% of assets related to the loans.

But all of these writedowns we're hearing about lower the amount of a bank's capital that is available to make and back-up loans. So long as we're having these problems, expect to hear about problems in the credit markets.

Wednesday, April 16, 2008

Translating "Fedspeak"

I am traveling today and may not get to a today's market until tomorrow morning.

Yesterday the Federal Reserve released the Beige Book which provides an excellent overview of current economic conditions. So, let's dig in. I'm going to offset the Fed's information and italicize the words.

Despite some variation across Districts, employment levels appeared to be little changed, on balance, from recent months. Some weakening in the job market was reported in the New York, Atlanta, Chicago, St. Louis, and Minneapolis Districts. Cleveland reported flat employment levels, while Richmond indicated mixed trends. Boston and Kansas City indicated modest increases in employment, with some deceleration indicated in the latter. Firms in the Philadelphia, Atlanta, and Minneapolis Districts reported layoffs, reductions in work hours, or hiring freezes in response to current or expected slowing in economic activity.


Above is a graph of establishment job growth. Notice we're just at the beginning of problems in the labor market. In addition, job growth during this expansion has been the weakest of any post WWII expansion. This implies we won't see the same level of lay-offs as we've previously seen in the economy.


Above is a one year chart of employment growth. Notice we're only at the very beginning of a slowdown.


However, as the above your-over-year percentage change indicates, we've been experiencing some problems for some time.


And we're also seeing an uptick in the unemployment rate.

Consumer spending weakened in most, but not all, Districts since the last report. In particular, automobile sales were generally reported to be flat or declining. Vehicle sales were described as unchanged or falling in the Philadelphia, Cleveland, Atlanta, and Dallas Districts and were characterized as weak in the Richmond, Atlanta, Chicago, and San Francisco Districts. However, Kansas City reported that auto sales rebounded in March, though they remained lower than a year earlier. Non-auto retailers reported that sales were sluggish or declining in ten Districts. Elsewhere, Boston noted mixed sales trends, and New York reported a modest pickup since the last report. Chicago, San Francisco, and, to a lesser extent, Philadelphia noted relative strength in demand for luxury goods.


As a result of weak job growth (see above), we've see weak wage growth


Don't forget the high levels of household debt, which I think have now become enough of a burden to slow spending.


Debt service payments have been increasing for the last few years


All of this leads to declining spending


And somewhat stagnant retail sales for the last few years or so


With a declining year over year number


Manufacturing activity was varied, with some Districts reporting a slight increase in activity, some indicating weaker activity, and several noting that activity was mixed or had held steady. Chicago, Boston, and Richmond reported that activity was rising, but not substantially, while New York, Kansas City, Philadelphia and Dallas all reported that activity had weakened. St. Louis and Cleveland said that activity had held steady, while Atlanta, Minneapolis and San Francisco saw activity as mixed.


Remember, the main story here is the weaker dollar:


Which has lead to an increase in exports:


But the slumping domestic economy is still hurting manufacturing as shown by the following regional indexes:


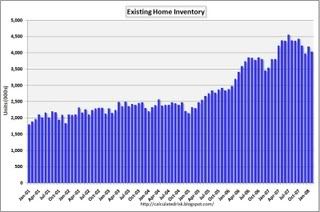
Housing markets and home construction remained sluggish throughout most of the nation, though there were few signs of any quickening in the pace of deterioration. Ongoing weakness in housing markets, in general, was reported in almost all Districts. Sales activity was generally reported to be declining in the Boston, New York, Philadelphia, Atlanta, St. Louis, Minneapolis, Dallas and San Francisco Districts, while Kansas City and Chicago noted slack demand and excess inventories. On the other hand, the Cleveland District saw some pickup in activity, while Richmond and Atlanta reported some pockets of improvement; Boston, Atlanta, and Chicago cited some recent pickup in traffic or buyer inquiries. New residential construction was reported to have remained at depressed levels, and none of the Districts reported any pickup since the last report.


First, there is a ton of inventory on the market. Here is a chart of total existing inventory from Calculated Risk


Notice in the story above economists were predicting 750,000 to 1 million more homes will hit the market in the next year as a result of the increase in foreclosures. That means at minimum we'll see no meaningful drop in inventory over the next year.

And here is a chart from CSFB that shows we're nowhere near the end of foreclosures related to changing mortgage terms. In fact, we have a second wave to go through in about a year and a half:


At the same time, the US consumer is in debt up to his eyeballs and can't afford to talk out much more debt.


So -- there is little reason to think inventory will decrease in the coming year and there is little reason to think people will rush into the housing market because they are already under a tremendous amount of debt.

So -- what does that mean for prices? If inventory isn't decreasing and fewer people are able to take out a loan that means prices will have to drop. And considering how out-of-whack home prices are anyway, that shouldn't be much of a surprise:


Compare the 1990s with the 2000s (but also remember we were working on another bubble in the 1990s). Despite the fact that things were good in the 1990 we didn't see a huge increase in prices. However, we made up for lost time in the 2000s. Simply put, prices are going to drop before they move higher.

Business contacts across all Districts continued to report increases in input costs and output prices. In particular, price increases were consistently reported for food products, fuel and energy products, and many raw materials. More specifically, increases in the price of chemicals, metals, plastics and other petroleum-based products were commonly cited. Most manufacturers have or are planning to increase prices in response to rising input costs, while the response of service firms has been more mixed, in part due to differences in competitive pressures. On balance, input costs have risen more rapidly than output prices, putting pressure on margins for many firms. Most Districts reported little change in retail price inflation, though Richmond and San Francisco noted some moderation. Most business contacts reported that wages were unchanged or were increasing moderately in all Districts. Business contacts in the Atlanta, Chicago, Cleveland, Dallas, Philadelphia, and San Francisco Districts indicated that there has been some upward wage pressure for skilled labor in some sectors that continue to experience shortages.


For anyone who reads my blog on a regular basis, you should know that inflation is nowhere near under control. Here's one example and here's another example.

However, for those of you who have forgotten, here are the relevant year-over-year charts.


So -- the short version is the economy is slowing and inflation is rising. Not a good combination.

Charts from Econoday

Today's Markets

More bad news on the inflation front. First, oil crossed the $115/bbl mark for the first time. Gasoline also settled at a record price (the dollar falling to a new low versus the euro didn't help matters). We also learned the year-over-year CPI rose 4%. Housing continues to struggle as housing starts fell to their lowest level in 17 years. And in the financial world, JPM Morgan's earnings dropped 50% and there are rumors that Merrill's writedowns this month could total $8 billion.


I'm using the 10-day chart to put today's rally in perspective. First, the market has been dropping since April 7. In baseball parlance, "we were due." Also note that in one day the market rallied enough to wipe out 50% to 75% of the drop. That means the market was probably oversold; traders were just looking for a reason to buy. Bottom line -- pulling the view point back to a longer perspective and we can see this wasn't the best rally out there. Now -- if we see the market continue to make strong moves like this over the next few weeks, then we'll be onto something.

What Inflation?

From Bloomberg:

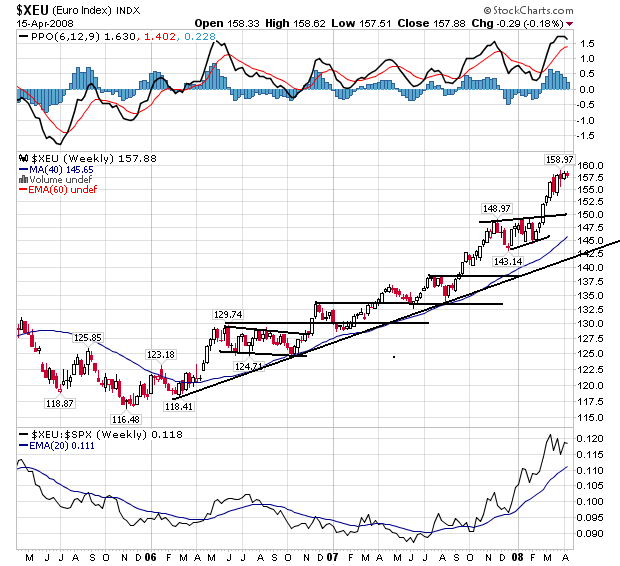
European inflation accelerated more than initially estimated in March, reinforcing the European Central Bank's resistance to cutting interest rates even as economic growth cools.

The inflation rate rose to 3.6 percent last month, the highest in almost 16 years, the European Union's statistics office in Luxembourg said today. The March figure is up from 3.3 percent in February and exceeds an estimate of 3.5 percent published on March 31.

Food and energy prices stoked inflation in March, and the euro extended its gains after the report, rising to a record against the dollar. ECB Executive Board member Juergen Stark yesterday said interest rates may not be high enough to contain inflation, while Greek colleague Nicholas Garganas said price pressure ``is more intense than previously foreseen.''

``Concerns about upside risks to the inflation outlook are unlikely to ease quickly, leaving little, if any, scope for the ECB soften its interest-rate stance,'' said Martin van Vliet, an economist at ING Group in Amsterdam. ``This may help push the euro-dollar to $1.60 in the short term.''

....

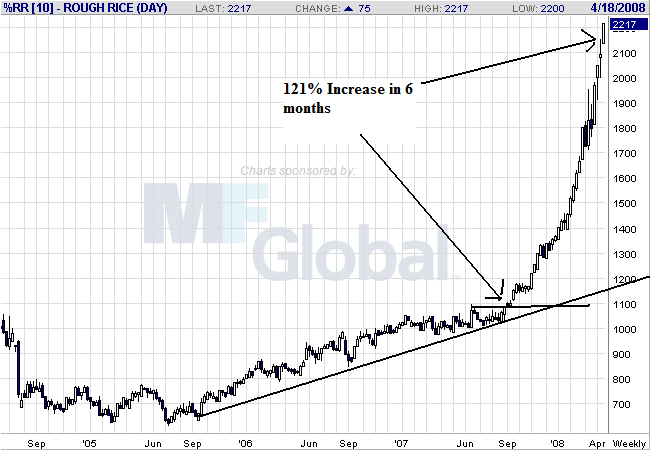
Food-price inflation accelerated to 6.2 percent in March from 5.8 percent in February, the highest since Eurostat began the current series in 1997. Rice climbed to a record $22.67 per 100 pounds today on rising demand and as floods delayed planting in the U.S. Wheat, corn and soybeans also have risen to records.

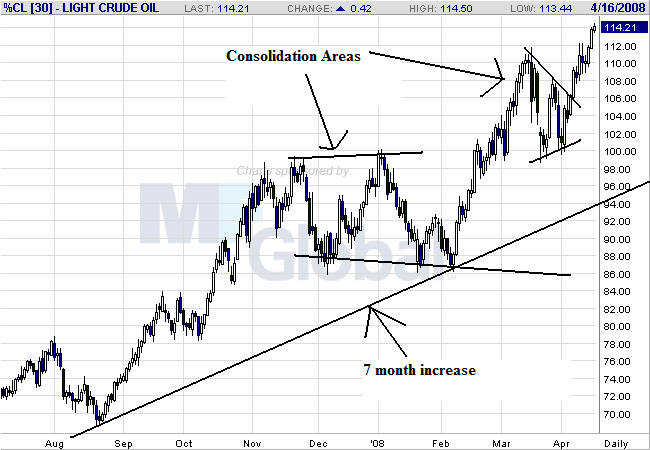
Energy-price inflation accelerated to 11.2 percent from 10.4 percent, the highest since May 2006. Crude oil has risen 79 percent in the last 12 months and reached a record above $114 a barrel yesterday.


First, notice that at least we're not the only country that is dealing with spiking inflation.

Secondly, notice the European Response -- not raising rates. The reason is the European Central Bank (ECB) is less concerned with preventing a recession. Instead, they view their mandate as inflation fighters or as promoters of price stability as extremely important. As a result, the euro is rallying:


On the chart, notice the following:

-- Prices have been rallying since 2006

-- Prices have continually moved through previous levels of resistance to hit new levels.

-- After hitting new levels prices consolidate, shaking out some players who take profits and inviting new players in to take new positions.

From Bloomberg:

Rice climbed to a record for a second day as the Philippines, the world's biggest importer, sought 1 million metric tons and floods delayed planting in the U.S., increasing concern of a global shortage.

The Philippines will hold a tender tomorrow for 500,000 tons of rice, with another to follow on May 5. A March tender filled just 61 percent of requirements at prices double those six months earlier. Last year, the country imported 1.9 million tons of rice, equivalent to about 15 percent of annual needs. Food lines have formed as people wait for rice.

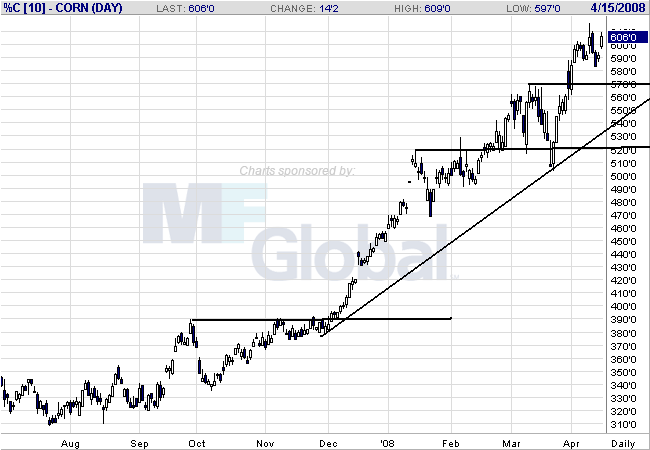
Rice in Chicago surged 2.3 percent today to $22.67 per 100 pounds on rising demand and export curbs from some producing nations, stoking global concern about inflation and the potential for social unrest. Rice, the staple food for half the world, has more than doubled in a year. Wheat has gained 93 percent in that time, while corn is up 61 percent.

``We've seen an unprecedented bull run in rice prices,'' Luke Chandler, senior commodities analyst at Rabobank Group, said in an interview today with Bloomberg Television. ``It's almost becoming like a supply shock because the countries that rely on the imports aren't able to access the available sources.''


Here's a chart:


Notice the extreme price spike in rice's price. This is an unsustainable move up in the long run -- meaning prices are really over-extended. But the problem is there is panic buying going on which will really spike prices hard in the short run. As a result, don't be surprised to see rice continue to move higher.

But it's not just rice:

U.S. rice, corn and crude futures soared to record highs Tuesday on supply concerns, in turn boosting gold on inflation worries.

On the New York Mercantile Exchange, the front-month crude settled up $2.03, or 1.82%, at $113.79 on a combination of supply issues, rising diesel demand in China and persistent dollar weakness. Crude futures later rose to a record high of $114.08 after settlement.

Rice and corn futures rocketed to all-time highs on tight world grain supplies and planting delays, with the rally in crude providing an additional boost to grains.

Chicago Board of Trade rice prices have doubled since last September, with Asian prices soaring even more sharply since January as big importers have rushed to build stocks on fears that supplies will become scarce as exporters clamp down on shipments.


Here is a chart of corn:


Notice prices are in a solid uptrend; they have moved through previously established resistance to establish new highs and then have sold-off to previously established upward sloping trend lines. This is a bullish chart.


Notice that oil has the same pattern as corn; prices have continued to rise, consolidate gains and then continue to move higher. Oil has a clear support level as well.

A Closer Look At the Treasury Market

It's been awhile since I've looked at the Treasury market, so let's take a gander. I'll be using the 7-10 year Treasury market chart as a proxy.


On the 1 year chart, notice the prices have been in a clear uptrend, continually making new highs by breaking through previous resistance levels. This is a solidly bullish chart.


On the six month chart, notice that prices rise then sell-off a bit after hitting new peaks. This is healthy.


On the six month SMA chart, notice the following:

-- Prices have continually bounced off the 50 day SMA as support

-- The 50 day SMA has continually moved higher.

-- The 10 and 20 have consistently been above the 50 day SMA, although the 10 and 20 have intertwined over the same period.

Tuesday, April 15, 2008

Today's Markets

Delta and Northwest announced they were merging (maybe this means they'll actually give passengers more room in their damn airplanes. United and continental said a deal between them is also a possibility. With oil and gas still rallying more mergers in the airline business will probably be in the works. Johnson and Johnson reported an earnings increase. On the housing front, we learned that Southern California home values dropped 24% from the previous year. And we saw the New York Fed manufacturing number increase although it's important to remember the overall trend is still down.


For the last two days, the SPYs have been in a trading range.


And that trading range may be at the end of a sell-off that started last week. In other words, the market may be making a short-term bottom here.


however, the QQQQs aren't showing any clear reversing formation here

>

But the Russell 2000 most certainly is.

What Inflation?

From the BLS:

The Producer Price Index for Finished Goods increased 1.1 percent in March, seasonally adjusted, the Bureau of Labor Statistics of the U.S. Department of Labor reported today. This advance followed a 0.3-percent rise in February and a 1.0-percent increase in January. At the earlier stages of processing, prices received by producers of intermediate goods rose 2.3 percent after increasing 0.8 percent a month earlier, and the crude goods index advanced 8.0 percent following a 3.7-percent rise in February.

Among finished goods, the increase in the index for energy goods accelerated to 2.9 percent in March from 0.8 percent in the preceding month. Prices for finished consumer foods turned up 1.2 percent after declining 0.5 percent in February. By contrast, partially offsetting the acceleration in finished goods prices, the rise in the index for finished goods less foods and energy slowed to 0.2 percent from 0.5 percent in February.


For God's sake -- can we please get off the "ex-food and energy" crap? I know of no one -- and I MEAN NO ONE -- who is not effected by food and energy prices. Over the last week we have seen earnings reports cite increasing energy costs as a price reason why profit growth is slowing. And yet the BLS is still trying to tell us that "ex food and energy" prices are decreasing. Please, stop this spin now. I want to get off.

All that being said, notice the increasing rate of prices all through the first paragraph. You can thank rising energy prices for most of it. But regardless of the reason, it looks like we're in for a less than fun ride on the inflation roller coaster.

We're Nowhere Near the Bottom In Housing

From the AP:

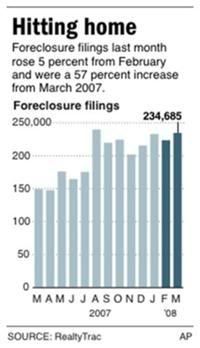
The number of U.S. homes receiving at least one foreclosure filing jumped 57 percent in March to 234,685, compared with 149,150 properties a year earlier. Filings include default notices, auction sale notices and bank repossessions.

The overall foreclosure rate is 5 percent higher than in February, which saw an unexpected month-to-month decline over January. March marked the 27th consecutive month of year-over-year increases in national foreclosure filings.

That meant one in every 538 households received a filing during the month. Forty-four percent were households that slipped into default for the first time and more than a fifth were homes banks took back.

Lenders took possession of homes at a sharply higher rate, up 129 percent over last year, as more homeowners relinquished their homes, said Sharga. Banks repossessed 51,393 properties nationwide, many of them without a public foreclosure auction.

"In a lot of cases, banks worked something out with the owner in advance and took back the keys and deed. For a homeowner, it's not as embarrassing and it's a little less of a blemish on their credit record compared to a foreclosure," Sharga said.

He estimates between 750,000 and 1 million bank-owned properties will hit the market this year, or about a quarter of the homes up for sale. In some areas, these properties will continue to slow sales and depress prices further.


The article had an accompanying graph:


Here's my thought pattern on housing -- and it hasn't changed much over the last 6 months or so.

First, there is a ton of inventory on the market. Here is a chart of total existing inventory from Calculated Risk


Notice in the story above economists were predicting 750,000 to 1 million more homes will hit the market in the next year as a result of the increase in foreclosures. That means at minimum we'll see no meaningful drop in inventory over the next year.

And here is a chart from CSFB that shows we're nowhere near the end of foreclosures related to changing mortgage terms. In fact, we have a second wave to go through in about a year and a half:


At the same time, the US consumer is in debt up to his eyeballs and can't afford to talk out much more debt.


So -- there is little reason to think inventory will decrease in the coming year and there is little reason to think people will rush into the housing market because they are already under a tremendous amount of debt.

So -- what does that mean for prices? If inventory isn't decreasing and fewer people are able to take out a loan that means prices will have to drop. And considering how out-of-whack home prices are anyway, that shouldn't be much of a surprise:


Compare the 1990s with the 2000s (but also remember we were working on another bubble in the 1990s). Despite the fact that things were good in the 1990 we didn't see a huge increase in prices. However, we made up for lost time in the 2000s. Simply put, prices are going to drop before they move higher.