Friday, December 14, 2007

Weekend Weimar and Beagle

I've got a very busy weekend ahead, so I'm not going to post anything until Sunday night. That's when I'll post a "week in review" of the markets with (what else) plenty of charts to get ready for next week.

Until then, here are three new pictures of my and the future Mr$. Bonddad's kids -- the four legged variety.


This is me holding a bone out of sight and getting Kate to look really alert.


This is Scooby wondering where Mom is.


And this is Sarge, who comes into the office on a regular basis and stares at me until I pet him.

OK -- take a break from the markets and economics for a few days. I know I will.

What Inflation?

From the BLS:

The Producer Price Index for Finished Goods rose 3.2 percent in November, seasonally adjusted, the Bureau of Labor Statistics of the U.S. Department of Labor reported today. This gain followed increases of 0.1 percent in October and 1.1 percent in September. At the earlier stages of processing, prices for intermediate goods moved up 3.7 percent after rising 0.1 percent in the prior month, while the crude goods index increased 8.7 percent following a 2.4-percent advance in October.

.....

Before seasonal adjustment, the Producer Price Index for Finished Goods advanced 1.6 percent in November to 171.3 (1982 = 100). From November 2006 to November 2007, prices for finished goods rose 7.2 percent. Over the same period, the finished energy goods index climbed 23.6 percent, prices for finished consumer foods increased 7.3 percent, and the index for finished goods other than foods and energy moved up 2.0 percent. For the 12 months ended November 2007, prices for intermediate goods increased 8.1 percent, while the crude goods index jumped 22.4 percent.


From the BLS:

The Consumer Price Index for All Urban Consumers (CPI-U) increased 0.6 percent in November before seasonal adjustment, the Bureau of Labor Statistics of the U.S. Department of Labor reported today. The November level of 210.177 (1982-84=100) was 4.3 percent higher than in November 2006.

.....

During the first eleven months of 2007, the CPI-U rose at a 4.2 percent seasonally adjusted annual rate (SAAR). This compares with an increase of 2.5 percent for all of 2006. The index for energy, which increased 2.9 percent in 2006, advanced at an 18.1 percent SAAR in the first 11 months of 2007. Petroleum-based energy costs increased at a 30.8 percent annual rate and charges for energy services rose at a 3.2 percent annual rate. The food index has increased at a 5.3 percent rate thus far in 2007, following a 2.1 percent rise for all of 2006. Excluding food and energy, the CPI-U advanced at a 2.4 percent SAAR in the first 11 months of 2007 after increasing 2.6 percent in 2006.


The Fed is now in a really terrible bind. The economy is clearly slowing so they want to lower rates. But look at the yearly increase in food and energy costs at both the wholesale and consumer level -- those are big jumps. These charts --

for agricultural prices


and oil


are really starting to hurt. That means the Fed is pretty much hemmed in. If they lower rates further they run the risk of getting seriously behind the inflation ball. But if they don't lower rates, the stand the chance of getting behind the economy ball.

I think these inflation figures are one of the reasons the Fed signed up with all those other central banks. That would allow the Fed to add liquidity without lowering rates and possibly stoking inflation further.

Either way, Bernenake and company have a really terrible policy choice ahead of them.

Thursday, December 13, 2007

A Closer Look at Energy

With oil recently making news highs -- and the possibility of further highs on the horizon -- it seems appropriate to look at the energy sector to see how the charts look.

First, here's a chart of oil:


Oil has been rallying all year. It came a breath away from hitting $100/bbl within the last month. Notice the clear pattern of higher highs and higher lows.

Let's take a look at various energy sectors. The charts are from Prophet which is a great sight for industry charts.


This is the only "bad" chart in the group. Notice this area has a habit of trading in ranges. It consolidated in 2006, rallied in early 2007 but now appears to be either forming a double top or another trading range.


Major integrated oil (think Exxon) is in the middle of a five year rally with two primary uptrends. However, the spike the index had over the last year may need some time to dissipate before another move up happens.


Pipelines are also in the middle of a five year rally, but they too may be experiencing a double top. However, even if this index pulls back there are two uptrends it can trade to for technical support.


Independent oil and gas is also in the middle of a strong rally, but like the majors it too has had a recent spike. These can be tricky from a trading perspective. While some indexes continue to rally, others stall a bit after a big move up. Considering oil's fundamental move, it seems unlikely we'll see a big drop.


Oil and gas equipment is also in the middle of a long rally. Notice this index consolidated for most of 2006 so a further sideways consolidation wouldn't be out of the question.


Drilling and exploration is also in the middle of a rally. It recently hit a high and is backing off a bit as traders take profits.

Bottom line: the energy sector looks good, with the exception of the refiners. But even they look like a good store of value should the market become volatile.

The Flight to Safety is Underway

Below are some charts that illustrate the market is moving into a capital preservation mode.


The health care ETF has been consolidating over the last year. It has recently broken out of the upper channel of this pattern. Considering the economy may be slowing, this is a sector that could benefit from a flight to safety.


The utility ETF has been rising since mid-August. It recently reached a new high but has sold off since then. This sector is benefiting from the flight to safety and the Fed's interest rate cuts. Utilities need a lot of capital and when the cost of capital drops it's easier for the sector to get financing.


Consumer staples are in a clear uptrend as well.


Despite their recent sell-off, the 7-10 year treasury market is doing very well.


The 20+ year sector of the market is still in an uptrend, but this is more suspect now. Prices have moved through resistance established in early March. However, there is still the uptrend that started in late June.


As the dollar has dropped, gold has clearly benefited. Right now it is consolidating in a triangle consolidation pattern.

Today's Markets

Did the market turn a corner today? Let's look at the charts. I'm going to use three day charts because they illustrate what I was just mentioned.


Notice on the SPYs there was a strong downward trend line that the index broke about 2 PM EST. Also note the triangle consolidation at the beginning of the day. This is important because the index didn't continue to move lower; instead it consolidated. Also note the rally coming out of the consolidation; it follows the 10 day SMA.


The QQQQs had a clear downtrend, but they didn't have a solid multi-day trend line like the SPYs. However, the QQQQs consolidated this morning and rallied about the same time as the other markets.


With the IWMs (Russell 2000) we have a triangle consolidation and a rounding bottom, followed by the afternoon rally.

So -- will the rally continue? A lot hinges on tomorrow's CPI report. If that number comes in hot, then traders may worry that the Fed can't lower rates any further. However, a tame number may spark more "the Fed can now lower rates" talk. So, tune in tomorrow at 7:30 AM for the CPI release.

Retail Sales Were Up, But ....

From the WSJ:

Retail sales increased by 1.2%, the Commerce Department said Thursday. Sales went up an unrevised 0.2% in October.

.....

Excluding gas and auto sectors, demand at other retailers last month increased by a robust 1.1%. Sales climbed by 2.5% at electronic stores; 0.6% at health and personal care stores, 1.0% at food and beverage stores; 1.2% at building material and garden supplies dealers; 2.6% at clothing stores; 0.3% at eating and drinking places; 1.9% at mail order and Internet retailers; 1.0% at furniture store sales; 2.2% at sporting goods, hobby and book stores; and 0.9% at general merchandise stores.


But.....

U.S. retail sales dropped for the second straight week as consumers postponed holiday gift purchases during what may be the worst holiday shopping season in five years.

Sales fell 2.7 percent in the seven days through Dec. 8, following a 4.4 percent decline a week earlier, Chicago-based research firm ShopperTrak RCT Corp. said yesterday. About 12 percent fewer shoppers visited stores last week compared with the same period last year, ShopperTrak said.

Consumers are completing their holiday shopping later than usual, and they're trimming purchases as they pay for $3-a- gallon gasoline and higher food costs. The National Retail Federation in Washington forecast a 4 percent increase in holiday sales this year, the smallest gain since 2002.

``High gas prices and oil costs are definitely taking money out of people's wallets,'' Michael McNamara, vice president of research and analysis at Mastercard Advisors in Purchase, New York, said yesterday.


So -- what is going on?

1.) My guess is the heavy discounting and extended holiday hours over Thanksgiving helped to drive sales and traffic. However, I have to wonder what this will to retailer's margins.

2.) The consumer is now heavily conditioned to expect massive Christmas incentives. In my opinion, retailers have really shot themselves in the foot over the long run by continually offering lower and lower prices and more and more incentives over the holiday season. Consumers are now use to these massive incentives from retailers and consumers will no longer do a big Christmas buy without them.

3.) Let's not forget about gas prices.


Notice that gas prices typically decline after the "summer driving season." However, they haven't done that this year. Instead, gas prices are approximately 70 cents higher this year than last year. That is probably having a negative impact.

4.) Financial market turmoil isn't helping consumer confidence. Remember the Fed lowered interest rates a few days ago and issued a bearish statement with the announcement. In addition, there is continued talk about a credit crunch among lenders.

5.) Housing still sucks. At some point, the decrease in mortgage equity withdrawals and declining home prices will start to seep into consumer sentiment.

PPI Up 3.2%

From the BLS:

The Producer Price Index for Finished Goods rose 3.2 percent in November, seasonally adjusted, the Bureau of Labor Statistics of the U.S. Department of Labor reported today. This gain followed increases of 0.1 percent in October and 1.1 percent in September. At the earlier stages of processing, prices for intermediate goods moved up 3.7 percent after rising 0.1 percent in the prior month, while the crude goods index increased 8.7 percent following a 2.4-percent advance in October. (See table A.)


This is the biggest increase since 1973.

The big issue was energy (imagine that when oil prices surged to nearly $100/bbl last month) which increased 14.1%. Ex-energy, the increase was .4%. Guess it's time to go back to "core" inflation; it looks so much better.

Exports Up Again

While the trade gap widened last month, the untold story (and one of the few bright spots in the economy right now) is that exports continue to grow:

The deficit has widened for two consecutive months after narrowing in the previous three. But the monthly gap remains well below the $67.6 billion deficit recorded in August 2006. The falling dollar has been a boon for exporters, making their products more affordable in global markets.

Export growth in the late summer helped offset the housing sector's drag on gross domestic product in the third quarter. Exports contributed 1.4 percentage points to GDP's annualized growth rate of 4.9%.

Some economists say exports will keep the economy from contracting in the current quarter. Morgan Stanley economists said in a note to clients that their "meager" forecast for growth in gross domestic product, now at 0.2%, would be negative if not for export growth. "The domestic economy already appears to be in mild recession in the fourth quarter," they wrote.


According to data from the Census Bureau, exports have increased 11.07% since January.

Wow -- it's nice to write something positive. I haven't had the opportunity to do much of that lately.

The Fed's New Plan Isn't Going to Work

From the WSJ:

In the biggest coordinated show of international financial force since Sept. 11, 2001, the Federal Reserve yesterday joined four other central banks in a plan aimed at coaxing banks to lend more readily at a time when fear has seized up world credit markets.

Just a day after it cut its key rate for the third time this year, the Fed introduced a new tactic, saying it will extend up to $40 billion in special loans in the next eight days to banks. To stoke banks' appetite to borrow and lend, the loans will carry less interest than Fed loans to banks usually do, and still can be backed by a wide range of collateral -- including the high-risk home mortgages at the heart of the current financial crisis.

.....

The central bank has cut interest rates three times since August by a total of a full percentage point, with the most recent quarter-point cut coming just on Tuesday. But bankers and investors nevertheless have become increasingly jittery, and more reluctant to lend to businesses, consumers and even to each other. Meanwhile, signs continue to spread that the American housing-market meltdown, the related turmoil in money markets and high energy prices are pressing on the U.S. economy. The Fed fears that reluctance to lend could push an already stalled economy into recession.

The Fed has faced two intertwined challenges since the financial crisis hit in August. One has been to cut rates enough to cushion the economy from a collapsing housing bubble, without igniting inflation. The other has been to overcome the credit crunch that stems from the housing woes -- and has muffled the impact of the rate cuts.

So far, the medicine isn't working. The rates banks offer to consumers and each other have stayed stubbornly high. The Fed tried to encourage financial institutions to borrow from its "discount window" but there were few takers. Separately, the Bush administration has prodded big banks to create a new entity to buy some mortgage-linked securities that aren't selling, and has pressed for mortgage-servicers to freeze interest payments on perhaps hundreds of thousands of homeowners whose mortgage payments are set to rise.


First, let's give Bernanke a hand because this is a really good idea in the current environment. In addition, Bernanke has lined-up support from other Central Banks, indicating Ben has some seriously good diplomatic skills. Bottom line -- it's good to see the monetary authorities working together to try and solve the problems in the credit market.

But it's not going to work. Why? Because liquidity isn't the issue; it's confidence. When a lender doesn't think a borrower is going to be around in 90 days -- or that the borrower is going to announce a major write-down to capital within the next 90 days -- the lender isn't going to lend. It's that simple.

The other problem is there has already been $76 billion in writedowns (see the post below). And we're just getting started:

Some of the nation's largest banks on Wednesday warned of higher losses in the fourth quarter as the turmoil in the credit and mortgage markets continues to weigh on the financials sector.

Bank of America Chief Executive Ken Lewis said the firm would have to write down a larger amount of its investment in some debt securities than previously planned.

.....

Also Wednesday, Wachovia Corp., said it expects to report fourth-quarter earnings is the range of 60 cents to 75 cents a share, and adjusted earnings between $1 and $1.15 a share. Analysts polled by Thomson Financial are looking for profit of $1.39 a share, on average.

In a separate regulatory filing Wednesday, PNC Financial Services Group Inc. The PNC Financial Services Group, Inc said it expects to report fourth-quarter earnings in the range of 60 cents to 75 cents a share, and adjusted earnings between $1 and $1.15 a share. Analysts polled by Thomson Financial are looking for profit of $1.39 a share, on average.


So long as we have announcements like this happening pretty regularly, no one is going to lend to anyone else. Everyone is going to horde cash because no one knows if they are going to be the next financial institutions to announce a write down. My guess is the Fed and the other central banks know this but they have to try and do something.

Wednesday, December 12, 2007

This is Not Good

Consider these two facts:

The biggest act of international economic cooperation since the Sept. 11 terrorist attacks is being put in place after demand for cash caused borrowing costs to rise. Banks and securities firms around the world have written down about $76 billion of assets this year after the market for mortgage-backed securities disintegrated.

The market for U.S. asset-backed commercial paper backed by assets such as mortgages and credit-card loans has shrunk for 17 straight weeks to $801 billion, falling 33 percent from its peak on Aug. 8, as structured investment vehicles continued winding down, according to data compiled by Bloomberg.


Those two pieces of information should scare the snot out of everyone.

Today's Markets

Wow -- what an interesting day. All of the charts say the same thing. The SPYs, QQQQs and IWMs all gapped up at the open, but then traded down for most of the day. However, at the end of the day there was a high volume buying spree on all of the indexes. This tells us that traders saw some type of bargain at the levels late in the day. It also tells us traders may have thought the selling was overdone.


On all of the daily charts we have an inside day -- a day when the highs and lows are inside the previous days highs and lows. This is like a mini-triangle pattern.


Today was extremely volatile. Anytime there is a change in sentiment of the degree we saw today you have to wonder what is going on. Instead of there being a more uniform view of the market -- that is, a majority of traders think the market is going firmly in one direction or the other -- today was extremely varied. The bears were in full force until the very end when the bulls took over.

Traders are trying to figure out exactly what is going on. And no one is really sure just yet.

More on the Fundamental Big Picture

In the previous post I wrote:

The dollar is still in a downtrend, oil is still high and the Federal Reserve is looking like they are behind the curve. Housing is still a huge problem, corporate earnings are not good, and confidence is low


Here are some charts to demonstrate those points:


The dollar has been dropping for almost two years. With the Fed loosening monetary policy I wouldn't expect this trend to change.


Oil's been rising for about three years. The Fed mentioned the effect of high oil prices in their statement yesterday.

Readings on core inflation have improved modestly this year, but elevated energy and commodity prices, among other factors, may put upward pressure on inflation. In this context, the Committee judges that some inflation risks remain, and it will continue to monitor inflation developments carefully.


While I didn't mentioned food prices, they've been rising as well.


That's three years of price increases.

Do I really need to go into housing? OK -- how about home prices?


'Nuff said.


Corporate profits are dropping

Here are some confidence charts.


The above is a chart of CFO confidence.

There is no silver lining in any of these data points; they are each negative in their own right. Combined they paint a very disturbing picture.

The Big Picture

Considering all of the craziness we've seen the markets over the last few weeks, let's fall back to the long-term picture to see where we are in relation to the big, over-all trend.


Starting in 2004, the SPYs began a multi-year trend channel. The SPYS broke out of this channel in late 2006 and have used the upper trend channel as support for a rally ever since. The SPYs are currently on top of this trend line still and have use it as support three times in the last year (see chart below).


So long as the SPYs stay on top of this upper trend line they will be in decent technical shape. Even if they fall through this line they will still have the lower trend line as support. The lower trend line is about 8% below the SPYs current level.


The QQQQs have two primary trends sill in place. The first is an upward sloping channel that started in early 2004. The second is a rally that started in mid-2006. However, the second rally no longer has a pattern of higher lows and higher highs. However, the QQQQs have not broken major long-term support for either rally yet. So the QQQQQs are still in good technical shape.


Like the QQQQs and SPYs, the IWMs started a long-term uptrend in early 2004. However, the IWMs have broken the long-term lower trend line and have since run into resistance at the lower trend line. This should concern traders. The Russell 2000 is an index of smaller cap stocks. These companies need a growing economy to increase their respective earnings. When this index declines, it is probably a sign that traders are not happy about the economy's prospects. In addition, the index's finding resistance at previous support is a technically concerning event.


The Transports broke a three and a half year uptrend last summer. They tried to rally beyond this trend line and failed. In addition, they have been in a clear downtrend since mid-summer. In other words, the transports are not confirming any upswing in the broader market. For those of us who still think Dow theory is relevant, this is a very troubling development for the broader markets.


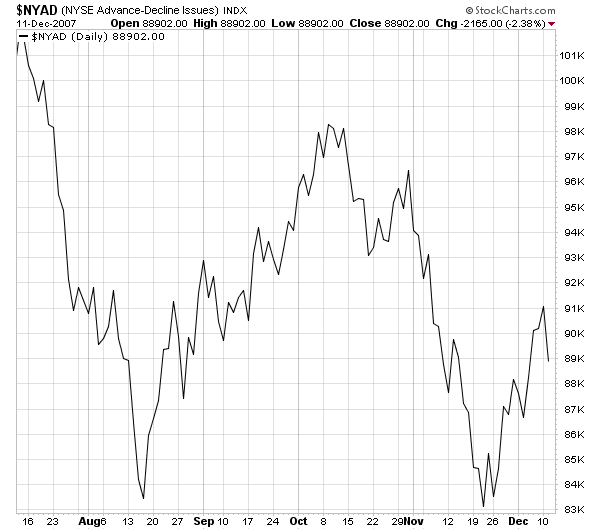
The New York Advance/Decline line has been increasing since late November. This is a good development.


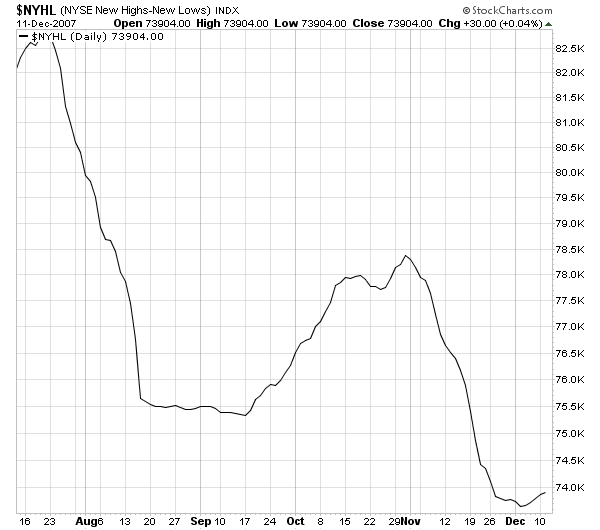
The new high/new low line may be bottoming. Considering the length of time this index was decreasing it's understandable it would take awhile to turn around.


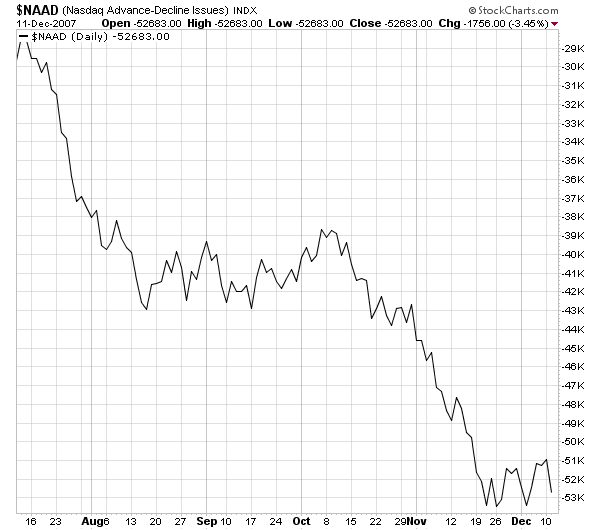
However, the NASDAQ advance/decline line is very troubling. This index has been rising far about two weeks, yet the A/D line is still stuck in a rut. This may indicate that a small number of companies are responsible for the last few week's upward move which is not the sign of a healthy advance.


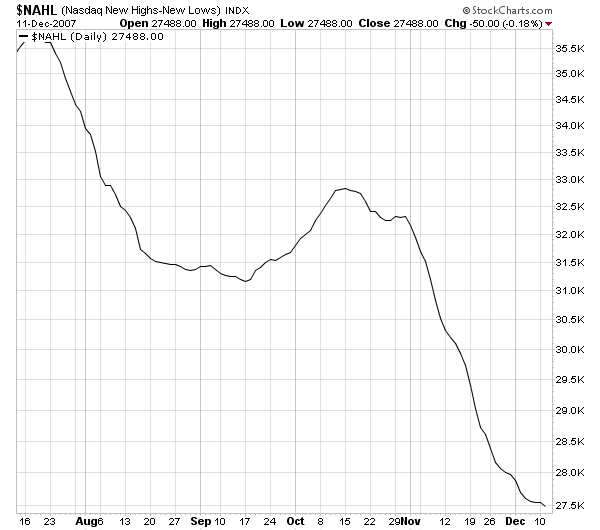
And the NASDAQ new high/new low index is still decreasing, which is another troubling sign.

A few weeks ago I wrote a long article titled 
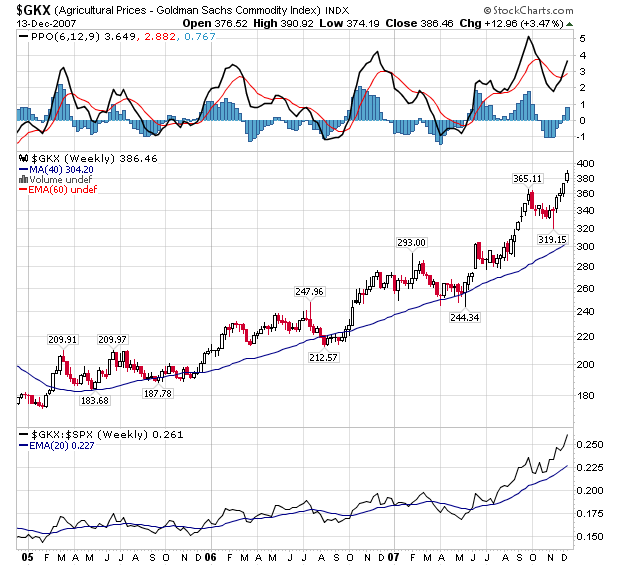
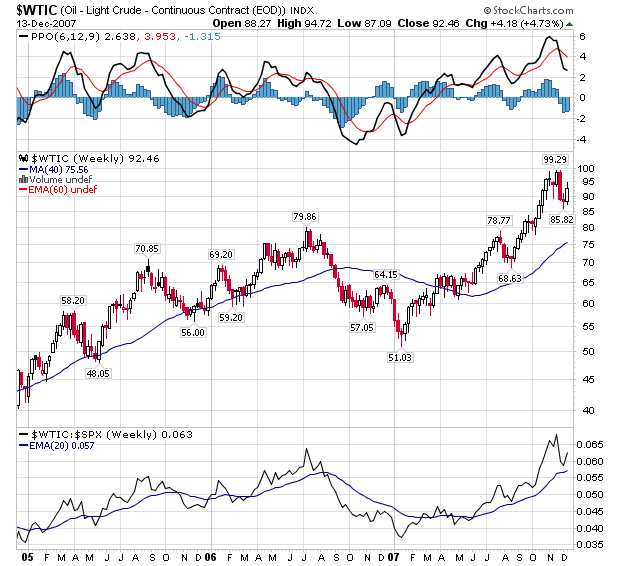
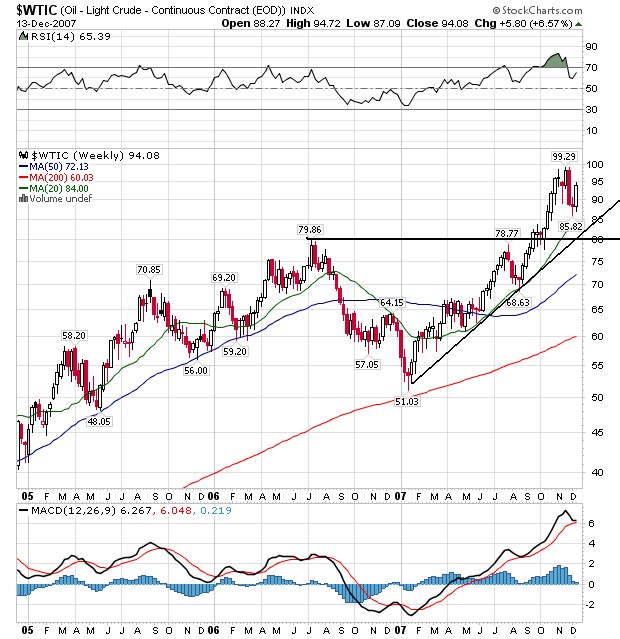
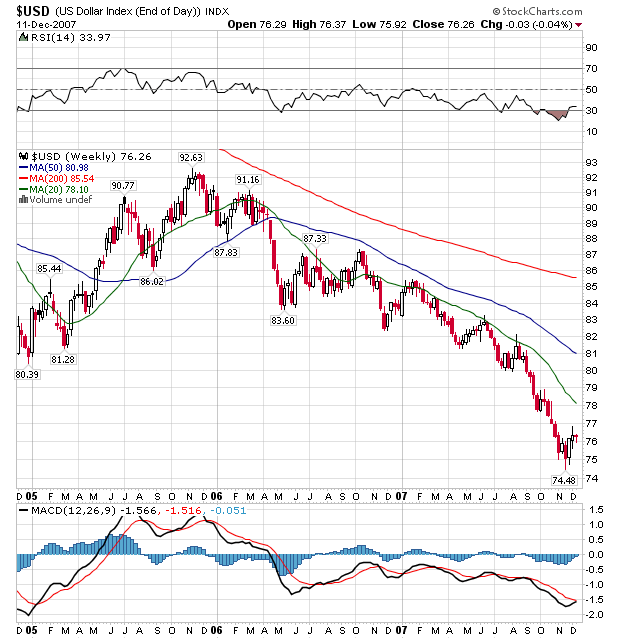
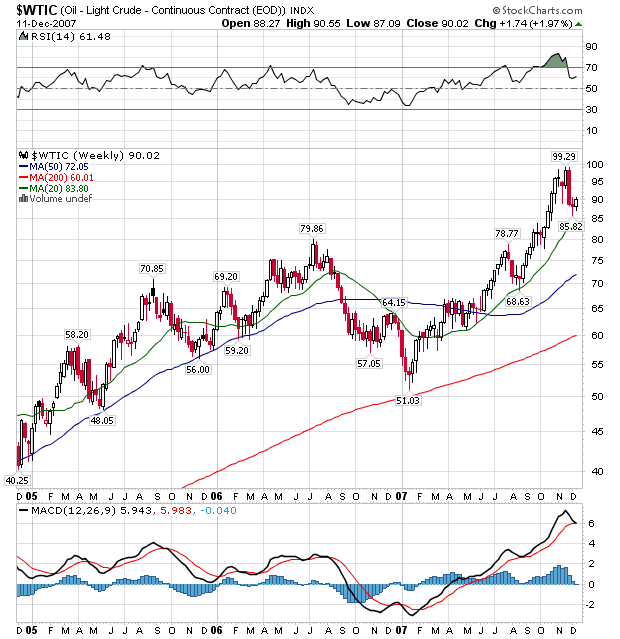
Is a Bear Market Developing. While the New York A/D line has gotten better since them, the Russell 2000 and Transports have at best treaded water. In addition, the NASDAQ's new high/new low index is very troubling, as is the NASDAQ's A/D line. The dollar is still in a downtrend, oil is still high and the Federal Reserve is looking like they are behind the curve. Housing is still a huge problem, corporate earnings are not good, and confidence is low. In short, there is still a ton of negativity out there in the economy. The fundamental picture is weakening and I would still expect the technical picture to follow-suit at some time. In essence, I expect the Russell 2000's and the Transport's moves to recur in the SPYs and QQQQs.

What We Have Here is a Failure to Communicate

The markets were very disappointed with the Fed's decision. Immediately after the announcement, the markets sold-ff hard. Looking back at the most recent Fed speeches, it's easy to see why the markets were so unhappy.

Notice these statements from Janet Yellen:

For example, there continues to be a strong demand to hold U.S. Treasury securities—which are the safest and most liquid in the world—leading to Treasury yields that are much lower than they were before the shock hit in mid-July. Of course, one reason for the decline in Treasury yields is that the Fed has cut the federal funds rate and the market expects substantial additional cuts in the future, reflecting the view that policy will ease further to offset the contractionary effects on economic activity of the financial turmoil. But another important reason is that there has been a worldwide “flight to safety.” Stated differently, the spreads of most risky assets above Treasuries have risen.

.....

Likewise, the cost of insuring investors against default on securities they hold, through derivatives known as credit default swaps, has jumped again in recent weeks and is far higher than normal.

.....

The mortgage market has been the epicenter of the financial shock, and, not surprisingly, greater aversion to risk has been particularly apparent there, with spreads above Treasuries increasing for mortgages of all types.

.....

Moreover, many markets for securitized assets, especially private-label mortgage-backed securities, continue to experience outright illiquidity; in other words, the markets are not functioning efficiently, or may not be functioning much at all. This illiquidity remains an enormous problem not only for companies that specialize in originating mortgages and then bundling them to sell as securities, but also for financial institutions holding such securities and for sponsors, including banks, of structured investment vehicles—these are entities that relied heavily on asset-backed commercial paper to fund portfolios of securitized assets.

.....

Depository institutions are increasingly facing challenges.


None of these developments is good. More importantly, these statements added to the belief that the Fed would address the problems in the market.

Fed President Kohn's statements added to the markets expectations:

At the same time, the term interbank funding markets have remained unsettled. This is evident in the much wider spread between term funding rates--like libor--and the expected path of the federal funds rate. This is not solely a dollar-funding phenomenon--it is being experienced in euro and sterling markets to different degrees. Many loans are priced off of these term funding rates, and the wider spreads are one development we have factored into our easing actions. Moreover, the behavior of these rates is symptomatic of caution among key marketmakers about taking and funding positions, and this is probably impeding the reestablishment of broader market trading liquidity. Conditions in term markets have deteriorated some in recent weeks. The deterioration partly reflects portfolio adjustments for the publication of year-end balance sheets. Our announcement on Monday of term open market operations was designed to alleviate some of the concerns about year-end pressures.


And then there are Bernanke's statements:

With respect to household spending, the data received over the past month have been on the soft side. The Committee will have considerable additional information on consumer purchases and sentiment to digest before its next meeting. I expect household income and spending to continue to grow, but the combination of higher gas prices, the weak housing market, tighter credit conditions, and declines in stock prices seem likely to create some headwinds for the consumer in the months ahead.

Core inflation--that is, inflation excluding the relatively more volatile prices of food and energy--has remained moderate. However, the price of crude oil has continued its rise over the past month, a rise that will be reflected in gasoline and heating oil prices and, of course, in the overall inflation rate in the near term. Moreover, increases in food prices and in the prices of some imported goods have the potential to put additional pressures on inflation and inflation expectations. The effectiveness of monetary policy depends critically on maintaining the public’s confidence that inflation will be well controlled. We are accordingly monitoring inflation developments closely.

The incoming data on economic activity and prices will help to shape the Committee’s outlook for the economy; however, the outlook has also been importantly affected over the past month by renewed turbulence in financial markets, which has partially reversed the improvement that occurred in September and October. Investors have focused on continued credit losses and write-downs across a number of financial institutions, prompted in many cases by credit-rating agencies’ downgrades of securities backed by residential mortgages. The fresh wave of investor concern has contributed in recent weeks to a decline in equity values, a widening of risk spreads for many credit products (not only those related to housing), and increased short-term funding pressures. These developments have resulted in a further tightening in financial conditions, which has the potential to impose additional restraint on activity in housing markets and in other credit-sensitive sectors. Needless to say, the Federal Reserve is following the evolution of financial conditions carefully, with particular attention to the question of how strains in financial markets might affect the broader economy.


The Federal Reserve's speeches were (and still are) very clear. They see a deteriorating situation in the economy and a worsening picture in the credit markets. Yet -- they did very little to alleviate either problem. The cut in the discount rate merely maintained the current Fed funds/discount rate spread. This implies the Fed really doesn't see the current credit market situation as a problem. And the 25 basis point cut seems too little in light of the Fed's last three public statements.

Now, in the Fed's defense there are two issues to consider. One is the dollar, which has been dropping hard since the Fed's last two cuts. A 50 BP Fed funds cut may have seriously damaged the dollar, sending it lower still. The second is inflation from food and energy prices, which the Fed specifically mentioned in their statement yesterday. Yet both of these issues were near absent from the Fed's pre-meeting public discussions. The dollar was completely absent and inflation was by far a secondary topic in relation to the credit market issues which took clear center stage.

The bottom line is the Fed screwed this one up big time. They told the markets the Fed was really worried about the credit markets but then didn't do much to alleviate those problems. Then the Fed said the economy is in trouble yet only cut rates by 25 basis points. This is why the markets tanked hard after the announcement. The Fed set the markets up and then dropped the ball in a big way.

Tuesday, December 11, 2007

Today's Markets

A long time ago I read the book Winning on Wall Street by Martin Zweig. He used to be a regular on Wall Street Week with Louis Rukeyer's (now if that statement doesn't date me, I don't know what does). It's a really good, common sense book that I would still recommend.

One of Zweig's comments was to always watch what the Fed is doing. He noted when the Fed cuts stocks advance. And that is exactly what I was expecting today.

That is, until I read the Fed statement (see below). This was a very bearish statement from the Fed -- there is not one thing good about what they said. The economy is slowing, the credit markets are in turmoil, and they have no idea what is going to happen. There is not one positive statement in the Fed's statement.

So, the markets tanked hard after the Fed released their statement.


On all of the charts, notice the extremely heavy, post-announcement selling. Bottom line, the markets realized the Fed is cutting rates because things just aren't that good right now.


On the daily SPYs, notice the heavy volume, the strong downward bar and the fact that prices closed through the 50, 200 and 20 day SMA. There was a lot of technical damage today.


On the QQQQs, notethe strong downward bar, the heavy volume and the fact that prices moved through the 50 and 10 day SMA. While there was a lot of damage to this average as well, there is still technical support at the upward sloping trend line and the 20 and 200 day SMA.


Notice the heavy volume and the fact that prices bounced bounced off the 50 day SMA, through the 100 day SMA and into the 20 day SMA. Also notice the index bounced off of the upward sloping trend line that has been in place for 4 years. This index took a huge technical hit today.

On all of these charts, notice we've been advancing since late November. The Fed's statement may have ended that advance in one swoop.