Saturday, October 27, 2007

How Strong Is the NASDAQ Rally?

From Barron's

The dichotomy in the market today is astounding. Stocks are either "haves" or "have-nots" and that means investors are herding into a narrow group and pushing them up to where they probably should not be. Unless the rally broadens, the result is usually not very good.

Strongly trending stocks, such as Research in Motion and Google, are the "haves" as they bounce back from setbacks that give stagnant and falling stocks a lot of trouble. For example, Monday's recovery rally left many charts with bullish price reversals and heavy volume. Money was pouring into beaten down stocks looking for bargains.

But Tuesday's session showed just how different the momentum leaders are. They kept rising while the others -- the have-nots - saw their technical buy signals erased.

Another have vs. have-not condition dogging the market is the heavy numbers of new 52-week highs and new 52-week lows at the same time. While major indexes are still within spitting distance of all-time watermarks, the presence of all those new highs is to be expected. However, the number of stocks reaching 52-week lows is quite inconsistent with a healthy market.


Now -- let's coordinate that statement with the following charts from Stockcharts.com

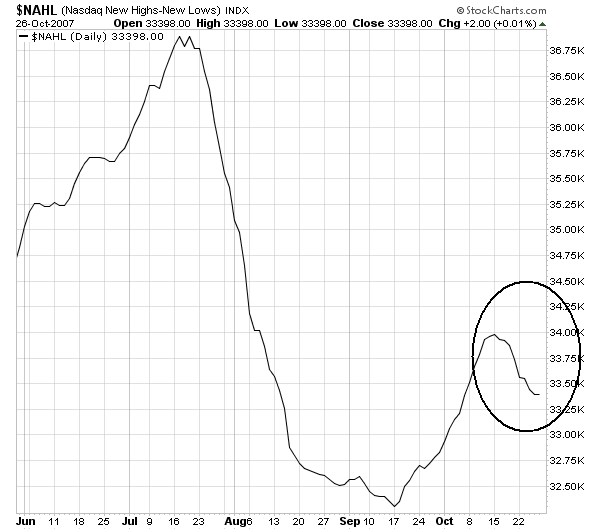
The NASDAQ new high/low index is dropping


And the NASDAQ advance/decline line is as well


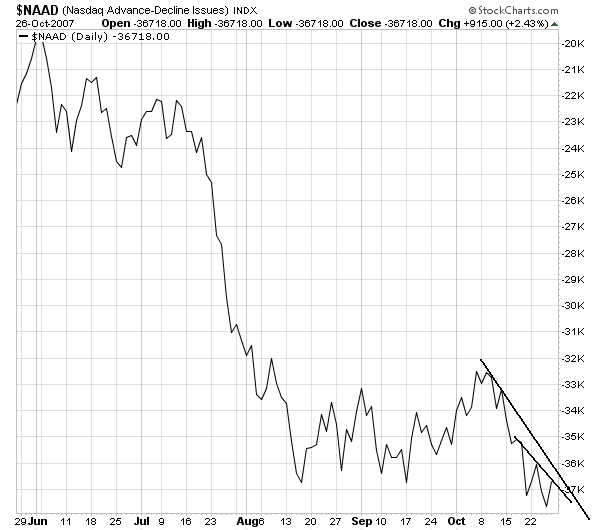
In a recent column Chris Perruna offered the excellent advice to "follow the leaders". This simply means that some stocks are leading the market higher. However, the lack of breadth on the high/low and advance/decline lines indicate these stocks are moving higher without other stocks following them higher. That's a warning sign.

The sum total of all this is simple: On the chart below, there aren't a lot of companies that are responsible for the run-up in the NASDAQ. So, when those companies start too sell-off, watch out.


Oh -- and did I mention the Transports are still below the 200 day moving average and are still in a trading range and still haven't confirmed the most recent rally?

Friday, October 26, 2007

Weekend Weimar

Normally at this time every week there would be a picture of the world's greatest dogs, the Weimaraner. However, I can't access Photobucket right now. So, picture the dog of your choice.

And stop thinking about the markets or the economy. In fact, do anything but that.

Housing Is Nowhere Near the Bottom

From Bloomberg:

Homeownership in the U.S. dropped for a fourth consecutive quarter, the longest string of declines since at least 1981, a sign that the key means of building assets for millions of Americans is weakening.

The homeownership rate, the percentage of households that own their residences, fell to 68.1 percent in the July-September period from 68.3 percent in the prior three months, according to a report today from the Census Bureau in Washington. The rate has been declining from a peak in 2004, which culminated a decade of gains fueled by easier lending standards and rising ownership for immigrants and younger households.


And now for the worst part of the report:

The Census Bureau report also found that a record 17.9 million U.S. homes stood empty in the third quarter as lenders took possession of a growing number of properties in foreclosure.

The figure is a 7.8 percent gain from a year ago, when 16.6 million properties were vacant, the Census Bureau said. About 2.07 million empty homes were for sale, compared with 1.94 million a year earlier, the report said.


There is no way to spin that number as anything but horrible. A 7.8% increase in the number of vacant homes is an indication there are serious problems in the housing market. And with credit conditions getting tighter there is really only one direction to go from here -- down.

Countrywide Issues Incredible Earnings Spin

From CBS.Marketwatch:

Beleaguered mortgage lender Countrywide Financial Corp. reported Friday its first quarterly loss in 25 years, a reflection of the turmoil in the credit markets that's roiled financial-services companies in the U.S. and elsewhere.

......

The Calabasas, Calif.-based company reported a third-quarter net loss of $1.2 billion, or $2.85 a share. In the year-ago period, Countrywide saw net income of $648 million, or $1.03 a share.

...

Countrywide said it took losses and write-downs of about $1 billion on non-agency loans and mortgage-backed securities. Moreover, The company increased its loan-loss provisions on its held-for-investment portfolio to $934 million, up from $293 million in the second quarter.

.....

The lender also raised its estimates of future defaults and charge-offs due to a worsening housing market, higher delinquencies and tighter credit. Countrywide plans to cut between 10,000 and 12,000 workers by the end of the year as a result of plunging origination volume.

...

"We view the third quarter of 2007 as an earnings trough, and anticipate that the company will be profitable in the fourth quarter and in 2008," Sambol said.


So Countrywide

-- Increased its loan loss provision by a factor of three

-- Writes off a billion dollars in loans

-- Increases the estimates of future defaults

-- Intends to lay-off 10,000 to 20,000

But this quarter is the "earnings trough".

That just doesn't pass the smell test.

Oil and Gold Rising, Dollar Falling (But There's No Inflation)

From the WSJ:

The dollar plunged Friday against several Asian currencies and reached a fresh all-time low against the euro, although it rose against the yen as investors sold the Japanese unit in favor of higher-yielding currencies.

"We're in an environment where we're seeing weak data from the U.S. and the market is expecting aggressive U.S. interest rate cuts," said Ian Stannard, a currency strategist at BNP Paribas in London. "That means we're going to see risk appetite back in place and we're going to see the dollar coming under continuing pressure too," he said. BNP Paribas expects the euro to reach $1.45 to $1.46 by the end of the year.


From the WSJ:

Crude-oil futures punched deeper into record territory Friday in Asia, briefly rising above $92 a barrel, and helped push spot gold prices to new multiyear highs.

With heightened tensions in the Middle East again putting supply flows at risk, and on the back of falling global crude and refined products stockpiles, expectations for a supply crunch going into the high-demand northern hemisphere winter have encouraged traders to go long and abandon bets on a price retreat.

"This week, in the wake of the latest [U.S. Department of Energy] statistics, traders are focusing on supply shortfalls in an environment of consistently growing consumption," Peter Beutel, president at trading advisory firm Cameron Hanover, said of weekly oil data released Wednesday. "It keeps coming back to one major fundamental factor: supply is running 1.8 million barrels a day behind demand."

.....

Record oil prices helped push spot gold prices to new multiyear highs, with the rally likely to continue, traders and analysts said. Gold rose 1.5% to a new 28-year high of $778.65 a troy ounce when the London bullion market opened, before easing somewhat to $776.10 an ounce.


When political tensions build in oil regions, oil's price increases. That's a no-brainer. We have tensions on the Northern Iraq border between Turkey and the Kurds and continuing rhetoric against Iran from the Bush administration. Put those two factors together and you get higher oil prices.

However, something that doesn't get mentioned nearly enough is the inter-relationship between the dollar and oil. Because oil is priced in dollars a decrease in the dollar is a de factor price increase in oil's price. With the dollar coming under pressure from a slowing economy and more rate cut speculation in the markets, oil traders are seeing the value of their investments decrease with the dollar. Hence, they fell obliged to big up oil just to keep pace with the dollar's drop. Hence you get the following inter-relationship between the dollar and oil over the last month or so as the dollar has continued to move to record lows.


And on top of those inter-related developments, the declining dollar and increasing oil prices are stoking inflationary expectations as evidenced by gold's move through upside resistance. Also note that gold has built an incredibly strong base over the last year which could give the metal one hell of a base to move higher from.


But remember --

1.) Despite oil's continued move higher

2.) The dollar's continual move to record lows, and

3.) Golds hitting new highs

core inflation is still low, so everything is hunky dory.

Thursday, October 25, 2007

Today's Markets

Actually, the real news is not today's trading, but the fact that the DIAs, SPYs, IWMs, IWRs, OEFs and QQQQs are all in a horizontal trading range. The question is why?

Simply put, a horizontal trading range indicates bullish and bearish sentiment is evenly matched. Over the last few days, we've had plenty of bearish news. Merrill Lynch posted huge write-down of assets, existing home sales tanked and durable goods orders fell for the second straight month. All of this should have sent the market lower.

But the news wasn't bad enough to break the lower band of all the trend lines. Why? I think the answer is the expectation that bad news increases the likelihood of another Fed rate cut. And with the Fed meeting approaching, traders aren't willing to sell just yet.

Anyway -- here are the 5-day, 5-minute charts of the DIAs, SPYs, QQQQs, IWRs, IWMs and OEFs == and they're all in a horizontal trading range.


Construction Spending Projected to Drop Next Year

From the WSJ:

In a closely watched report expected to be released today, McGraw-Hill Construction will forecast that spending on commercial and manufacturing buildings, such as offices, warehouses and hotels, will decline 7% next year, in dollar volume, and 10% in the number of square feet of space built. That would be a sharp turnaround from this year, when commercial and manufacturing construction is expected to end the year up 11% in dollar volume.

The McGraw-Hill forecast is based on the company's tracking of construction projects, including the issuance of building-permit data by local governments. That data, known as construction starts, are an indicator of future construction spending and often correlate strongly with actual construction spending.

The strength in the commercial sector until now had been offsetting the decline in the housing market. That appears to be changing, though continued growth in institutional construction, such as universities and hospitals, and road construction will provide somewhat of a balance. The pattern of having one sector up while the others were down "has been a moderating force," says Robert A. Murray, vice president for economic affairs at McGraw-Hill Construction, a unit of McGraw-Hill Cos., a New York-based publisher. (Please see related story.)


This is a very important story. Here's why.

According to the Census Bureau, from August 2006 to August 2007, residential construction spending decreased from $631 billion to $529 billion, or a decrease of $102 billion. Over the same time, nonresidential construction has increased from $555 billion to $637, or $82 billion. Nonresidential construction has increased from 46.79% of total construction spending in August 2006 to 54.54% in August 2007. In other words, nonresidential construction has really helped to limit the negative impact of the declining housing market.

If that total slows down then 2008 could be an incredibly ugly year.

Wednesday, October 24, 2007

Why Transports Matter

I harp on the importance of Dow Theory a lot. Basically, if the economy is improving business will make more "stuff" and people will buy more "stuff" which means more "stuff" will have to get from point A to point B.

But while the SPYs rallied after the last Fed rate cut, the transports have been mired in a trading range. In fact, the transports have been below the 200 day simple moving average (SMA) for almost three months now.


Here are some of the earnings stories from the sector.

Railroads fall (Wednesday 10/24):

Meanwhile, analyst Jason H. Seidl cut his rating on shares of Burlington Northern to "Neutral" from "Outperform," saying the stock has less potential for growth after a 17 percent year-to-date stock price increase.

He noted that while the company posted third-quarter earnings that beat Wall Street expectations, the near future is expected to be challenging as carload demand continues to wane.


Norfolk Southern Profit Drops:(10/24)

Norfolk Southern Corp., the fourth- largest U.S. railroad, said third-quarter profit fell 7.2 percent on declines in coal shipments and freight moved by a combination of trains and trucks.

Net income decreased to $386 million, or 97 cents a share, from $416 million, or $1.02, a year earlier, the carrier said today in a statement. Earnings trailed analysts' estimates, and the shares tumbled the most in two months.

``I was a bit surprised in the negative reaction in the stock,'' said Jason Seidl, a Credit Suisse analyst in New York, noting that the railroad announced Oct. 9 that profit would drop. He rates Norfolk Southern as ``neutral.''


Con-Way Profit Drops: (10/23)

Freight and logistics company Con-way Inc.'s net income fell 41 percent in the third quarter due to restructuring costs and weak demand, the company said Tuesday.

Profit amounted to $37.3 million, or 78 cents per share, versus $63 million, or $1.24 per share, a year earlier. Revenue rose 3 percent to $1.11 billion from $1.08 billion. Results included restructuring and acquisition costs of $7 million, or 9 cents per share.


Heartland Express' earnings drop slightly (10/23):

Heartland Express, Inc. (Nasdaq:HTLD - News) announced today financial results for the quarter ended September 30, 2007. Operating revenues for the quarter decreased slightly to $146.6 million from $147.1 million in the third quarter of 2006. Operating income for the quarter was negatively impacted by a $4.3 million decrease in gains on disposal of property and equipment. Net income decreased 25.5% to $17.1 million from $23.0 million in the 2006 period. Earnings per share were $0.18 compared to $0.23 for the third quarter of 2006. The Company expects a minimal amount of gains from disposal of property and equipment in the fourth quarter of 2007.


Ryder Net Rises 1% (10/24):

Ryder System Inc., the largest U.S. truck-leasing company, said third-quarter profit rose less than 1 percent as a softening economy reduced demand.

Net income climbed to $65.5 million, or $1.11 a share, from $65.3 million, or $1.06, a year earlier, the Miami-based company said. Revenue rose 2 percent to $1.65 billion, curtailed by a 15 percent decline in short-term truck rentals. The shares fell.

``The U.S. economy is moderating and they're seeing softness in certain patches of it,'' said Todd Fowler, an analyst with KeyBanc Capital Markets in Cleveland, in an interview. ``There's some concern as to how long softness in rental markets will last.'' Fowler rates Ryder ``hold'' and doesn't own shares.


Simply put, we're just not moving that much more "stuff" right now.
That makes me wonder about how good the underlying economy really is -- and how strong the market really is.

Today's Markets


Can you say roller-coaster? Today we learned that existing homes sales are still declining and Merrill Lynch has heavy exposure to the credit crunch. These news items tanked the market at the opening. However, the markets rallied after twice testing important support around 149. Myu guess is there were some by programs that were triggered at these levels.


Looking at the 5 day chart, we have some really interesting dynamics to look at.

1.) The markets could be forming a double bottom. That would make sense as traders begin to anticipate the next Fed meeting.

2.) However, the lower trend line from the Monday-Tuesday rally acted like resistance today. The market could conceivably move higher with this line acting as resistance to further upward moves.


On the daily chart, we have a bounce from the 50 day SMA on decent volume. But we also have two really weak candles -- hammers, which indicate the market is looking for direction right now. In other words, there really isn't a firm trend in place in either direction right now.


Like the SPYs, the QQQQs had a double bottom today. But they have returned to the top range they were in for the last few weeks.


The daily chart illustrates the range a bit better, although it is still sloppy. In general, we are looking at roughly 52.50 to 54 as the topping range right now.

Existing Homes Sales

For more info on the numbers, go to Calculated Risk. All I'd do is copy their charts anyway.

What Inflation?

From the WSJ:

Cold weather hasn't hit the Northeast yet, but record heating-oil prices mean high heating bills are on the way for many residents.

About eight million U.S. households -- largely in New England and the Central Atlantic states -- rely on heating oil to run their furnaces each winter. Last week, heating-oil futures hit a record of $2.36 a gallon, up more than 40% since the start of the year.

Weather forecasters are predicting a colder winter than last year, despite the unseasonably warm October in the Northeast. That's going to lift heating costs no matter what fuel a homeowner uses. Consumers who use heating oil, though, will feel the most pain. Their winter heating bill for the season is expected to average $1,785, compared with $891 for households that use natural gas, according to the Department of Energy. Unlike crude oil, natural-gas prices have been relatively restrained in the U.S. this year.


Here's a chart that accompanied the article. Notice there is no continued increase in prices over a long period of time (/irony).

Tuesday, October 23, 2007

Retail and Consumer Stocks Not Looking Good


Yesterday I posted two stories (one on Target and one on Coach) that stated some retailers were showing signs of stress. The chart above -- which is the retailer ETF -- bears this out. Notice the index (whose three largest positions are in Home Depot, Target and Lowe's) is below the 200 day simple moving average (SMA) -- bearish territory. However, the index doesn't have a firm upward or downward bias and hasn't had one for about two and a half months. That means the index is consolidating and looking for signs about which way to go.

The direction may be bearish:

Companies ranging from pancake house chain IHOP to high-priced handbag seller Coach reported signs of the continuing U.S. consumer pullback, sending retail and some restaurant stocks lower.

Adding to the pressure, discounter Wal-Mart Stores cut its capital spending plan for the current fiscal year, dragging down U.S. stock indexes and boosting bonds.

Meanwhile, Target on Monday lowered its September sales expectations.

.....

On the restaurant side, IHOP posted an $11.6 million quarterly loss due to an interest-rate hedge it put in place related to its planned acquisition of Applebee's International.

But earnings from operations also came in below analysts' estimates and the company said fewer customers came into its restaurants.

Falling traffic was also an issue at Brinker International
Brinker International Inc which posted a 21 percent drop in quarterly profit.


Unlike the retailers, the consumer discretionary ETF has a clear downward bias.

1.) It is below the 200 day SMA.

2.) It broke through a an upward trend a few days ago

3.) Prices are below the SMAs, which will pull the SMAs lower in the near future.

Other sectors of the consumer cyclical aren't looking good either.


Homebuilders are heading lower -- and lower, and lower.

1.) Prices are below the 200 day SMA by a long margin.

2.) Prices are at or below all the SMAs

3.) The shorter SMAs are below the longer SMAs.


Consumer Leisure and Entertainment tried to get above the 200 day SMA, but just couldn't hold above that technically important line. Now the index is hugging the 50 day SMA for technical support. In addition, the ETF broke through a two month trend line about a week or so ago.


The Consumer Service ETF has the same technical characteristics as the consumer Leisure and Entertainment ETF. The one difference is prices here are below the 50 day SMA, making this chart technically weaker.

The bottom line is traders are definitely not confident in the US consumer right now.

Scary Charts From the IMF

The IMF has issued it's latest report on the world economy. The charts below are from that report. They need further explanation.


Today's Markets


There's good news and bad news with the 2-day chart. The good news is the market continued to rally from Monday's opening low and the market closed on higher volume at the daily high.

However, the market spent most of the day recovering lost ground. Ideally, you want a trend to move more or less continually in one direction. Today, the market opened higher and then fell back. This is not fatal, but not great either.


The SPYs moved through the lower, downward sloping trendline from last week's sell-off. That's another good technical development.


This is real tell -- today printed a hammer, which is considered a reversal signal in candlestick analysis. In addition, today's volume is less than ysterday's volume, indicating a lack of enthusiasm among traders.


The 10-day QQQQs tell a completely different story. Bolstered by Apple's earnings report (which was simply great), the QQQQs opened higher, consolidated, then moved higher.

But the real story is the top line -- which has provided upside resistance for the last 10 or so days. Today's action sent the index right to important technical levels.


The only drawback to this chart is the declining volume. Other than that, we have an index that is moving higher. The question is will the QQQQs continue their upward move tomorrow?

I have to wonder how much of the SPYs move was in sympathy with the QQQQs rather than because of other factors. Apple had been a market darling for the last year and its earnings report was probably one of the first stories traders read today. However, the SPYs' biggest sector is financials, which are not doing well right. This is just a hunch on my part.

Coach Warns of Low Traffic

From the Street.com

Same-store sales, or sales at stores open at least a year, jumped 19.3% in the U.S. In Japan, where Coach has a significant presence, same-store sales rose at a low-single-digit rate.

U.S. retail stores recorded a 10.8% rise in same-store sales, while outlet stores saw a 27.3% surge.

For the key holiday period, however, Coach forecast a same-store sales rise in the low-single-digits for its North American retail sales, though it expects its outlet stores will generate growth at least in the mid-teens.

"While we're well positioned for the holiday season, we are, however, concerned with recent traffic trends in our North American retail stores, reflecting the retail environment and the unusually difficult comparisons with last year," said Chairman and CEO Lew Frankfort. "Thus, we believe it's prudent to be more conservative in our comparable-store sales guidance for the balance of the fiscal year."


Coach had a great quarter with strong sales growth. However, they warned about the holiday season. Remember what I posted below about retail stores managing investor's expectations about the holiday season; this could be another move in that area. However, there are pressures on the consumer this year that weren't there last years -- a very weak housing market and higher gas prices.

Target Lowers Same Store Sales Guidance

From CNBC:

Target cut its outlook for October sales at stores open at least a year on Monday, the second month in a row the discount retailer has lowered its same-store sales forecast, as investors begin to focus on how the holiday sales season will measure up.

Target now expects same-store sales to rise between 2 percent to 4 percent, down from a forecast earlier this month of an increase of between 3 percent and 5 percent.

In a recorded message, the retailer said its reduced forecast was partly based on "greater-than-normal daily volatility and continued disappointing sales results for the first two weeks of October."


It's important to remember that retail companies work very hard to manage Christmas expectations. Typically, they issue cautionary/concerned outlook early in the season in order to lower expectations. Then an earnings beat looks more impressive giving traders reason to bid up retail shares. In addition, counting out the US consumer is never a good idea. In other words, the death of the consumer has been greatly exaggerated.

That being said, there are important economic headwinds to consumer spending this year. Housing has been in a slump for a little over a year Gas prices are still high and oil is spiking. Polls indicate the consumer is concerned about the future and consumer confidence is lowering. Add these factors together and you get a consumer under pressure who may just cut back on holiday shopping this year.

Positive Mortgage Developments

From CNBC:

Countrywide Financial, which is in the middle of a crisis amid rising delinquencies and foreclosures, on Tuesday, said it plans to offer refinancing options to subprime borrowers.

The largest U.S. mortgage lender said it will initiate a program to refinance or modify up to $16 billion of Countrywide loans for borrowers who are facing an adjustable-rate mortgage reset through the end of 2008.

Countrywide said borrowers currently in a subprime loan with a strong payment history it will offer options to refinance into prime or Federal Housing Administration loans.


Of course, the total amount of resets in the market probably had something to due with that (hat tip, Calculated Risk)


Simply put, from Countrywide's perspective it's good business to start figuring out a way to allow people to not get hammered by spiking resets. Especially considering Congress is now getting into the act:

The chairman of the House Financial Services Committee is pushing for broad, industrywide overhaul of the way mortgages are offered, securitized and supervised.

Rep. Barney Frank (D., Mass.) introduced legislation that would, among other things, prohibit mortgage brokers, bankers and others from steering borrowers toward more-expensive loans in order to receive greater compensation. It would prohibit prepayment penalties on subprime loans and limit prepayment penalties on prime loans.

Mr. Frank said the bill's goal is to "diminish predatory lending while continuing to support a rigorous mortgage market. It creates a national standard for giving mortgages, originating mortgages, which will cover every mortgage originator," he said in a conference call with reporters.


Predatory lending practices have been remarkably underreported during the last few years. That does not mean it hasn't gone on; it's just the story isn't as a high a priority for journalists. However, it would not surprise me to learn there were some fairly unscrupulous practices going on in the lending world.

Monday, October 22, 2007

Another Big Bank Takes a Subprime Hit

From Bloomberg:

Commerzbank AG, Germany's second- largest bank, dropped in Frankfurt trading after Chief Executive Officer Klaus-Peter Mueller warned of larger-than-expected losses related to U.S. subprime investments.

The shares fell as much as 1.54 euros, or 5.1 percent, to 28.60 euros, the biggest drop since Sept. 7. They closed 2.9 percent lower at 29.26 euros, valuing the Frankfurt-based bank at about 19.2 billion euros ($27.2 billion).

Mueller told the Financial Times Deutschland that the original 80 million euros in provisions set aside for writedowns on 1.2 billion euros of subprime-linked investments ``won't be enough,'' spokesman Peter Pietsch confirmed today. Analysts forecast subprime-related losses of 100 million euros to 450 million euros, according to M.M. Warburg's Andreas Plaesier.


Those are some large and heavy losses to be reporting. If it's any comfort, at least they aren't alone.....

This statement should really warm investors' hearts:

Commerzbank's chief executive said Sept. 20 that it is impossible to say if the provisions are sufficient because of difficulties assessing the value of subprime-related investments. Deutsche Bank AG, Germany's biggest bank, and Swiss rival UBS AG this month wrote down the value of securities because of surging defaults of home loans to U.S. buyers with patchy credit histories.

Today's Markets


Futures were way down and traders were worried. However, the markets consolidated their losses in the morning in a triangle consolidation pattern, then rose slightly for the remainder of the day. It's important to remember that on the daily chart the SPYs were near the 50 day SMA, which is a technical support level.


On the 8-day chart notice that today's action didn't break through the lower trend of last week's downward trend. In order to fully recover we'll need to move through that level.


On the daily chart, note the 50 day SMA is acting as a center of gravity right now. Also note the 10 day SMA is heading lower and is about to move through the 20 day SMA. However, both of the smaller moving averages have a ways to go before either crosses the 50 day SMA. But also note that prices are below the 10 and 20 day SMA, which will continue to pull these numbers lower.


On the 2-day QQQQ chart, note the same pattern as the SPYs -- a triangle consolidation in the morning followed by a bit of a rally.


On the longer chart, notice the QQQQs have a trading range in place, and today's action broke through the lower trend line. That's technically good news.


On the daily chart, notice we have a lot of traffic in the 52-54 area. But also notice that prices are still below the 10 day SMA, which acted with a bit of resistance in today's action.

Today felt like a "breather" from last week's action. There was no significant economic news, and the earnings news was decent. In addition, my guess is there are some bulls out there that are looking to buy on the dip.

But we get some housing news later this week as well as some other earnings out there.

Spain Has Housing Problems

Does any of this look familiar?

Home prices in Spain more than doubled over the past 10 years, but the average price of an existing home has fallen slightly since July, according to real-estate agent facilisimo.com. France experienced its first quarterly home-price decline in almost a decade in the third quarter, according to its federation of real-estate agents, while Irish house prices in August were 1.9% below the year-earlier level.

...

Low interest rates were a potent stimulant in Spain, which experienced one of the biggest housing booms in Europe. The European Central Bank, mindful of slowly expanding, big economies on the Continent, kept interest rates low for much of the first part of the decade -- often lower than the rate of inflation in Spain. That encouraged Spaniards to borrow money.

Last year, Spanish families on average paid six times their annual salary to buy a home, compared with 3½ times salary in the late 1990s, according to the Bank of Spain, the central bank. Immigration and an influx of wealthy tourists scooping up coastal property fueled skyrocketing prices.

Construction accounts for about 10% of Spain's annual output, compared with about 7% in the U.S. Last year, 726,000 new homes were built in Spain -- more than France, Germany and Britain combined, even though those three countries together have more than five times as many people. Housing helped push Spain's economic growth to 3.9% last year, its fastest rate since 2000.


When a central bank lowers interest rates to the point where they are literally giving money away, assets whose value is based on leverage increase in value. It's that simple.

Short End of the Curve Rallying

From Bloomberg:

The yield on the two-year U.S. Treasury note traded near its lowest since September 2005 as a drop in European and Asian stocks fed demand for the relative safety of government debt.

Yields have fallen by 41 basis points from a week ago as anxiety over $300 billion owed by structured investment vehicles, or SIVs, raised risk aversion, boosting demand for U.S. Treasuries. Stocks fell after the Group of Seven finance ministers and central bankers said the turmoil in the credit markets will slow economic growth. U.S. index futures declined.

``The key question going forward will be whether we see further equity weakness, which could lead bond yields lower,'' said Andreas Meurer, an institutional fixed-income strategist at Deka Investments GmbH in Frankfurt


Here is a chart of the short end of the Treasury curve's prices. Remember the prices and yields move inversely, so yields are dropping. Notice the big rally last week.

European Bankers Have the Right Idea; Fed Bankers Don't

From Bloomberg:

European Central Bank officials said food costs and record oil prices are fanning inflation pressures in the 13 euro nations, suggesting they may support further interest-rate increases.

``Inflation risks have increased recently'' and the ECB will ``have to counter these risks should they materialize,'' said Germany's Axel Weber in an Oct. 20 interview after a meeting of the Group of Seven nations in Washington. Austrian colleague Klaus Liebscher said the threat of faster inflation is ``significant.''

...

Trichet said Oct. 19 it's ``clear'' a further increase in energy costs will have ``an inflationary impact.'' Liebscher said ``there is no relaxation concerning the risks to price stability, it's the other way around.'' Greece's Nicholas Garganas said he's also concerned about prices in 2008.

Policy makers said the surge in energy costs is likely to keep inflation above the ECB's limit this year and next. Weber said futures markets show investors expect the cost of crude to stay ``above what we had based our projections on.''


Compare the above to this:

Federal Reserve Governor Frederic Mishkin said inflation measures that exclude food and energy costs are a ``better guide'' to underlying changes in prices.

Changes in price indexes without food and energy ``provide a clearer picture of underlying inflation pressures,'' Mishkin said in the text of remarks to the HEC Montreal Macroeconomics and Monetary Policy Conference today. ``If the monetary authorities react to headline inflation numbers, they run the risk of responding to merely temporary fluctuations.''

Mishkin argued that both so-called core and headline measures of inflation are useful to policy makers and the central bank shouldn't rely on any one gauge. Sustained increases in energy costs can push up expectations for inflation, he said, noting that recent gains in oil are a ``reminder that shocks can persist longer than one might have first expected.''


One set of central bankers can read a chart like this one:


And this one:


One set of central bankers either can't read a chart or doesn't think the above charts are that important.

Sunday, October 21, 2007

Overview of the Markets

Below is a rundown of the large industry sectors. Here I'm going to take a look at the larger, broader averages to see how they look from a technical perspective.


The SPYs moved through the 10 and 20 day simple moving averages (SMAs) on Friday. In addition, volume was high. Also notice that volume has been increasing since the market top a little over a week ago. The SPYs are trading right at the 50 day SMA. Because of the rapid fall I wouldn't be surprised to see some type of "buying on the dip" rally.


The QQQQs were forming a triangle consolidation pattern at the top of the latest rally. However, they have broken that trend and moved through the 10 day SMA on Friday on heavy volume. However, the QQQQs are trading right at the 20 day SMA which could provide some technical support. In addition, tech has the benefit of not being mortgage related.


The DIAs have moved through the 10, 20 and 50 SMA -- although the break through the 50 SMA is a small break and could be easily reversed. Like the SPYs, we've seen volume increase on this downturn.


The S&P 100 tracker (the OEF) has moved through the 10 and 20 day SMA. It is now resting at the 50 day SMA, where it sold-off to on heavy volume on Friday.


The S&P mid-caps have moved through the 10 and 20 day SMAs and is now resting on the 200 day SMA. In addition, they have clearly broken the lower trend channel. Friday's sell-off was on high volume.


The Russell 2000 is now below the 200 day SMA -- bearish territory. Friday's sell-off was on heavy volume.

Aside from the QQQQs, all of the other averages are not in good technical shape. Traders are clearly moving away from the riskier areas of the market (the Russell 2000) and are even selling off the larger, more stable companies (the OEF). The riskier areas of the market (the mid and small caps) are at or below the 200 day SMA, indicating bearish sentiment towards there sectors.

Short version -- the markets do not look good right now.