Saturday, September 15, 2007

Weekend Weimar


It's Saturday. Do anything except think about the markets or economics.

Friday, September 14, 2007

Today's Markets


The markets opened lower on the news from England that the third largest UK mortgage lender received an injection of money from the bank of England. However, weak retail sales figures boosted hope of a rate cut (I dealt with this development here).


The weekly chart shows a solid gain for the week. Today's sell-off didn't even touch the high Fibonacci level, which should be encouraging for bulls


The daily chart shows a slight increase of upside bias because the close was above the 50 day SMA. However, this week's advance has continued to advance on week volume which is not an encouraging sign.

The short version is everybody is waiting on the Fed right now.

Banking Lawyer Sees More Mortgage Losses

From Marketwatch:

The subprime contagion has already forced several of the nation's largest home lenders into bankruptcy, but a banking attorney specializing in the mortgage industry says the carnage is far from over.

"This isn't the last of it," said Kal Das, head of the global bank and institutional finance and restructuring practice group at law firm Seward & Kissel, in a telephone interview. "Many more mortgage lenders will go down in the coming months."


A long time ago, a high school friend's new years resolution was to bring back the phrase "duh" and "no-duh".

This definitely falls in the "no-duh" category.

Retail Sales Disappoint

From Marketwatch:

U.S. retail sales increased a healthy 0.3% in August, but all the gains were for cars and trucks, the Commerce Department said Friday.

Excluding motor vehicles, sales fell a disappointing 0.4%, below expectations, and the biggest decline since last September.

Sales were slightly weaker than expected, but the upward revision to July's sales figures to 0.5% put the level of sales near expectations. Economists surveyed by MarketWatch had expected total sales to rise 0.6%, with a 0.2% increase in sales excluding autos. See Economic Calendar.

Sales were tepid outside of autos, although furniture and electronics sales showed some life. Sales at the malls, grocery stores, restaurants, and garden centers were weak.


From CNBC:

Sales at U.S. retailers rose a smaller-than-expected 0.3% in August and they recorded the biggest decline in almost a year when car sales were stripped out, a government report showed on Friday.

Excluding motor vehicles and parts, retail sales fell 0.4% last month, the sharpest drop since September 2006, the Commerce Department said.

Analysts polled by Reuters were expecting sales to gain 0.4% and to rise 0.2% when cars and parts were stripped out.

Retail sales excluding cars, parts and gasoline, fell 0.1%, the steepest decline since April.

So-called core retail sales -- which exclude cars, gasoline and building materials -- were unchanged in August after a 0.8% gain in July.


Here's a link to the Census Report.

The report has a several very revealing categories.

First, total retail sales for the the period of 06/07 - 08/07 (the latest three month period) only increased .6% from the the 03/07 to 05/07 period. This is a rolling three month indicator. For the same period, total sales ex-autos rose 1.2%. This indicates auto sales are a big drag right now. In fact, for the same set of three month periods, auto sales are down 1.9%.

Looking at the year over year changes, let's first get the implicit GDP price deflator. According to the BEA, the GDP price level was 116.347 in the second quarter of 2006 and 119.532 for the second quarter of 2007. That's an increase of 2.73%.

Non-adjusted

Total retail sales increased 3.7%.
Retail Sales Ex-Autos increased 3.9%

Adjusted

Total Retail: about 1%
Total Retail Less Autos about 1.2%.

These are not impressive numbers.

So Much For Easing Credit Markets

Hat Tip to Scapusniac

From the WSJ

In one of the highest-profile instances of a central bank coming directly to the rescue of a commercial bank in the current credit crisis, the Bank of England agreed to provide emergency funding to Northern Rock PLC, one of the United Kingdom's largest mortgage lenders.

...

The Bank of England's move -- the first time it has acted as a lender of last resort in this way since gaining independence on interest-rate policy in 1997 -- comes two days after its governor, Mervyn King, condemned some of the liquidity-providing measures other central banks have taken in the last month as needlessly encouraging risk-taking. In written testimony to the U.K. Parliament's Treasury Committee, Mr. King said the bank stood ready to take action in case of a severe shock to the banking system, but also warned that "if risk continues to be underpriced, the next period of turmoil will be on an even bigger scale."


From Bloomberg:

Northern Rock Plc got emergency funding from the Bank of England, the biggest bailout of a British lender in 30 years, after a freeze in money markets left the mortgage provider unable to finance itself.

Northern Rock shares plunged as much as 26 percent to a six- year low after the company said today the central bank will provide an unspecified amount of credit. The Newcastle, England- based bank is the U.K.'s third-biggest lender by gross mortgages with loans worth 17.4 billion pounds ($35 billion) as of June 30.

The rescue stoked concern among investors and depositors that other financial firms that rely on short-term credit rather than deposits may be vulnerable. The Chancellor of the Exchequer Alistair Darling authorized the move, saying the Bank of England will step in as the lender of last resort ``where institutions face short-term liquidity difficulties.''

``This is a set of circumstances that I've not seen in 25 years,'' Chief Executive Officer Adam Applegarth said on a call with journalists. ``It's a substantial program, it is at a penalty rate. The facility will provide a solid ground base.''


From the WSJ:

European markets fell Friday, after Northern Rock, one of the United Kingdom's largest mortgage lenders, said it has agreed with the Bank of England to raise liquidity as needed through either secured borrowings or repurchase facilities.

The news rehashed fears that the fallout from the recent subprime and liquidity crisis is far from over. "There are only two important questions in our mind," said analysts at Credit Suisse in London. "What is a base valuation for Rock? And what does it mean for other banks?" (See related article.)


Over the last month or so the ECB has injected a ton of liquidity into the credit markets. In public statements they have stated they will continue to do so. However, it appears the credit market tightening is starting to take its toll on the UK mortgage market.

As a result of this keep an eye on the following here in the US:

1.) XLF: the ETF for the financial sector.
2.) SHY: the ETF for the 1-3 year Treasury market

Also keep in mind the Countrywide Financial announced a big credit package yesterday. This could mitigate some of the effects of this development.

Thursday, September 13, 2007

More Signs of Credit Markets Easing

From Bloomberg:

Kohlberg Kravis Roberts & Co.'s bankers have found buyers for the highest-yielding loans financing its purchase of U.K. pharmacist Alliance Boots in a sign demand for credit may be improving.

Deutsche Bank AG, JPMorgan Chase & Co. and UniCredit SpA, which last month abandoned selling 6 billion pounds ($12 billion) of mostly senior loans, probably will next week finish syndicating 750 million pounds of mezzanine debt that ranks last for repayment, two bankers involved said.

KKR's eight underwriters have been saddled with all of the 9 billion pounds of debt financing Europe's biggest leveraged buyout after investors rejected high-risk, high-yield loans. Banks in the U.S. are attempting to raise $16 billion of loans for KKR's acquisition of First Data Corp. in the biggest debt sale since rising U.S. mortgage defaults led to the highest borrowing costs for buyout firms in four years.


This, combined with the Countrywide release and the commercial paper news release from the Fed are all encouraging signs.

Today's Markets

This was the big news:

CALABASAS, Calif. (AP) -- Countrywide Financial Corp. boosted its borrowing capacity by $12 billion as the mortgage lender struggles to weather the slowdown in the housing market, the company said Thursday.

The move came after the largest U.S. home lender borrowed $11.5 billion and sold a $2 billion stake to Bank of America in recent weeks so it could keep operating its retail banking and mortgage businesses.


In addition:

The decline in the U.S. commercial paper market slowed last week, prompting speculation that the worst of the short-term credit rout may be over.

U.S. stocks rose and Treasuries fell after the Federal Reserve reported short-term debt dropped by $8.2 billion, compared with a decline of $54.1 billion a week earlier. That coincided with Countrywide Financial Corp. obtaining new financing and banks finding buyers for loans to fund Kohlberg Kravis Roberts & Co.'s buyout of Alliance Boots.


Traders took this as a sign that credit market problems were easing and bid the market up accordingly.


Today there were two trends. The first was a rally that started with an upward gap at the open. The market rallied and formed a head and shoulders top formation then sold-off below the neckline right before the close. The market printed a big volume bar at the 3:45 mark which I think was traders taking some money off the table from the longer run we've had (see next chart).


The markets have been rallying since mid-morning on Monday. That's why I think the big volume coming out of the head and shoulders formation was traders selling from this mini-rally.


By way of comparison, I've included this chart of the IWNs (Russell 2000). Notice that while this index started to rally at the same time as the SPYs, it peaked early yesterday morning and has traded in more of a sideways move since. It broke through resistance briefly a little after lunch but couldn't maintain upward momentum. The sideways action may indicate that traders are still shying away from the more speculative areas of the market right now and are favoring the large cap S%P 500 issues over the small caps.


Finally notice that this weeks rally has occurred on decreasing volume. That's a bad technical development.

Today's Markets

Here was the big news:

Countrywide Financial Corp. boosted its borrowing capacity by $12 billion as the mortgage lender struggles to weather the slowdown in the housing market, the company said Thursday.

The move came after the largest U.S. home lender borrowed $11.5 billion and sold a $2 billion stake to Bank of America in recent weeks so it could keep operating its retail banking and mortgage businesses.


In addition:

The decline in the U.S. commercial paper market slowed last week, prompting speculation that the worst of the short-term credit rout may be over.

U.S. stocks rose and Treasuries fell after the Federal Reserve reported short-term debt dropped by $8.2 billion, compared with a decline of $54.1 billion a week earlier. That coincided with Countrywide Financial Corp. obtaining new financing and banks finding buyers for loans to fund Kohlberg Kravis Roberts & Co.'s buyout of Alliance Boots.


Traders took this as a sign the credit markets are easing up and bid the market up accordingly.

New Confirming Idea?

A commenter made a really good observation:

Bonddad, permit me to offer an observation regarding the need for the transports to confirm the industrial's rise. That approach was valid for an extractive and manufacturing economy in which things get moved around.

In a service/information economy, wouldn't a better confirmation be found in an index focusing on telecommunications and maybe airlines? Those would represent the transport of electrons and people involved in passing information between operating nodes.


First, I still think a confirmation from the Transports is vital for two reasons. First, the US still makes things. Secondly, the US consumes a great deal and a lot of the products we consume come from overseas which still have to get to the retail level.

However, I also think that a confirmation from telecommunications is a very interesting idea. The US is shifting to a more information/knowledge based economy so for the economy to grow communications would also have to grow.

To that end, here are three charts of the TTH or Telecom Holders Trust.

Three Year Chart/1 Week Time Frame


The three year chart is very straightforward. The index rallied from mid-2006 to mid-2007 and then sold-off. The index broke the uptrend in early August of this year.

1 Year Chart, 1 Day Time Frame


The one year chart simply offers more detail of the change in trend and the trend break. What's encouraging about this chart is the drop has been gradual and disciplined. Aside from the sharp drop in early August when all of the indexes dropped sharply.

Six Month Chart, 1 Day Time Frame


The six month shows a chart that is clearly moving lower, but in a very disciplined way. Notice the following.

1.) The index dropped to a level above the 200-day moving average and then rallied. That means at minimum traders don't want to send this index into bear market territiry.

2.) The three shorted SMAs (10,20 and 50) are all moving lower, although the degree of the drop is gradual.

I want to add that I'm not completely sold on this idea. It's not that it's a bad idea by any stretch of the imagination. It's that there area a lot of ins and outs that need to be thought through. However, it's a damn good observation and one that deserves serious consideration.

Dollar Breaks Key Technical Level


This chart is very straight-forward. The market traded a little below 80 about a month ago. The dollar has clearly broken through that level. In addition, all of the moving averages are pointing lower and the smaller SMAs are below the longer SMAs. All of these factors add up to a high probability of further declines.

Wednesday, September 12, 2007

Health Care ETF Looking Interesting

With the "R" word now being used with a bit more frequency, it makes sense to look at some of the more conservative areas of the market. Health Care fits the bill. People will continue to get sick regardless of the overall economy's health. While the sector may not be super-exciting, that may be an extremely attractive proposition during periods of extreme volatility.


On the year long chart we some the following technical picture. There is a 1-year uptrend in place -- albeit a very slightly upward sloping uptrend. The XLV's dipped below this for a few days about a month ago, but have rebounded since. There is also a sharper upward sloping trend that started 2-3 weeks ago in place. There are two important technical barriers the index has to break before it can make a solid move higher. The first is resistance established earlier this year. The second is a downward sloping trendline that formed resistance for the ETFs decline starting in early June


This chart shows in a bit more detail where the current price is in relation to the above mention resistance levels. Notice an upward move in the next week through both lines of resistance would indicate a possible further move upward.


From a simple moving average perspective, notice the 10 and 20 SMAs are both moving higher and the 10 day SMA is above the 20. While the 50 day SMA is still moving lower its trajectory has decreased. Finally, the ETF crossed the 200 day SMA today.

I want to caution -- I'm still not a big fan of the overall market. The advance/decline lines don't look good and the transportation average has not confirmed any upward move. In other words, the overall picture isn't great. But it you want to stay in the market, moving to a more conservative sector makes sense in the current environment. And health care clearly fits the bill.

Today's Markets

The SPY's were up .2% today. That isn't the best gain we could see, but it beats going down (unless you're short the market).


There are two possible trendlines in today's action. The first is labeled trendline A -- it is the upper trendline in the chart. If this is the correct trendline the the market sold-off at the end of the day breaking trend. However, the lower trendline (trendline B) may be correct, in which case we closed right on top of the line.

Tomorrow's action will tell us which trend line is important to the market.


Notice we have a three day uptrend in place right now. This charts makes me think that trendline B from above is the correct trendline for this market.


Today's transport's action did not confirm today's advance. That's not a good sign. Remember the basic underpinning of Dow theory. If business is expanding, it will need to transport new stuff to new places. That makes transportation stocks attractive. But if transportation isn't rising, traders don't think that transportation earnings will increase making the stocks less attractive. But transportation earnings drop in a declining economy.


While the daily action shows three days of advances, those advances have occurred on continually decreasing volume. That means traders are progressively less excited about this 3-day run-up. Combine that with the transports sell-off today and you have a very unconvincing market.

Transport Average Still Sending Bearish Signal

Here is a chart of the SPYs. Notice that for the last several days, the average has been moving up.


But look at the Transports. They consolidated in a triangle pattern and then dropped, where they have been consolidating further.

Tuesday, September 11, 2007

Agricultural Prices Spiking

From Bloomberg:

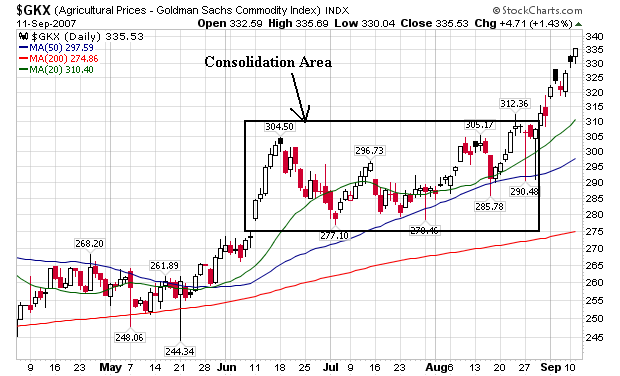
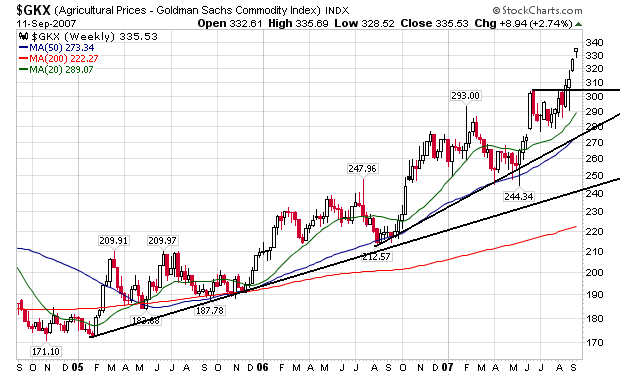
Wheat prices rose to a record, passing $9 a bushel in Asian trading, on concerns that declining global output will further shrink inventories at a 26-year low.

Reserves of the grain in Canada, the world's second-largest wheat exporter, plunged 29 percent at the end of July from a year earlier, Statistics Canada said yesterday. The U.S. may cut its forecast for the crop in Australia to 18 million tons, from 23 million metric tons in a report today.

Wheat prices have more than doubled in the past year, raising costs at companies such as Premier Foods Plc, the U.K.'s biggest maker of cakes, Nissin Food Products of Japan and Sara Lee Corp. The grain is used as livestock feed and to make cakes, noodles and bread, with one bushel enough to make 73 loaves.

``It is feeding through to the consumer, it's gone up high enough to do that,'' said Tobin Gorey, commodity strategist with Commonwealth Bank of Australia Ltd. in Sydney. ``The market is in a real frenzy. The news flow continues to be negative.''


Here's a chart of wheat. Notice it has really started to spike over the last few months.


Here's a chart of the Goldman Sachs Agricultural Index. It consolidated earlier this year and then started to move higher.


And notice on the weekly chart we have a two year continual uptrend.

Oil Prices Hit Record

From Marketwatch:

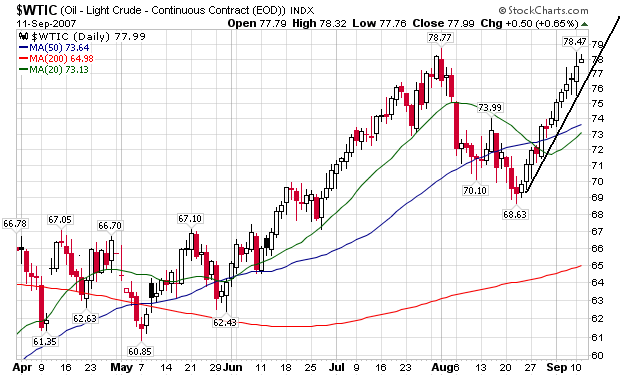
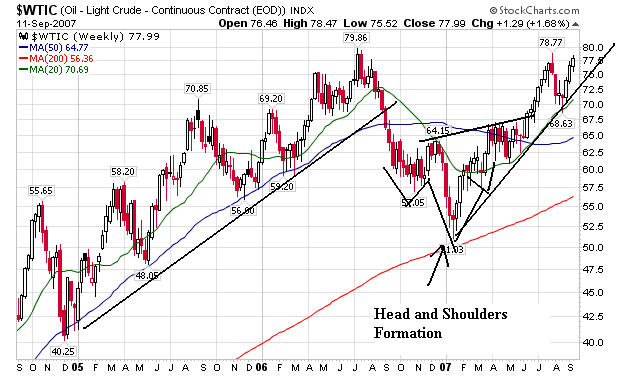
Crude-oil futures marked their highest closing level ever for a benchmark contract on the New York Mercantile Exchange Tuesday after some of the world's major oil producers decided to raise their daily output by 500,000 barrels per day, starting Nov. 1.

Traders had a difficult time digesting the news. Initial reports following the announcement from the Organization of the Petroleum Exporting Countries weren't clear as to whether the increase was to the cartel's official production quota or to its actual output, which has been estimated at about 1 million barrels above the quota.

But "what OPEC did was raise its production target from 25.8 million barrels per day to just over 27.2 million barrels per day -- an increase of about 1.4 million barrels per day," said Kevin Saville, a managing editor at Platts, who is on site at the meeting in Vienna.


It's been awhile since we looked at the chart, so let's see what they say.


On the daily chart, we have a simple, upward trendline. We also have three moving averages moving up. That's pretty straightforward.


On the weekly chart, we see the sell-off last year when Goldman rebalanced their energy index. From the winter of 2006 to the spring of 2007 the index consolidated in a head and shoulders formation and has rallied since. There are all three SMAs moving up. In short, this is a pretty bullish chart.

There are some fundamental issues driving oil prices higher.


While oil stocks are clearly above their historical range, they have been decreasing for the last two months or so. Decreasing supply = increasing price.


Gas stocks are clearly at very bad levels. The disconnect between the fairly high oil inventory relative to the low gas stockpiles indicates there may be some problems in the refining market.


Gas prices usually start to drop in the fall after the end of the summer driving season. However, with gas stocks so low, I have to wonder if prices will remain elevated through the fall -- at least at levels higher than last year.

Today's Markets

From the AP

Wall Street rose sharply Tuesday as investors grew more confident that the Federal Reserve will lower interest rates next week, even after its chairman gave no clues about the central bank's intentions. The Dow Jones industrials rose 180 points.


Earlier, Bloomberg had a different take:

U.S. stocks rallied the most this month on growing evidence consumers are weathering an economic slowdown and bolstering profit growth.


I think the rate cut idea is probably the best explanation. However, traders are failing to take into account the split nature of the Fed's perception of the overall picture. Right now traders want a rate cut, but there have been some pretty hawkish statements from several Fed governors over the last few days.

The markets are in a one and a half day rally right now. Notice the nice consistent upward trend. Also notice there was a big buy at the end -- which is usually a bullish indicator.


Here's an 8-day chart. I'm putting this up to show the market is still trading near important Fibonacci levels from about a week or so ago.


Finally, here's the daily chart. Today we moved up from the 200 day SMA, but the volume wasn't that impressive. In addition, remember these charts on market breadth which just aren't that enticing. Underneath the surface of the market we're seeing some indecisive trends that don't inspire confidence.

QQQQ's Update

Here is a chart of the QQQQs. Notice that like the SPYs, this index formed a reverse head and shoulder's pattern. However -- unlike the SPYs -- they didn't break the neckline. Also note they are still moving up along the upward slanting trendline started in mid-August. These are all good technical indicators.


Here's the same chart with the simple moving averages. Note the index bounced off its 200 day SMA, but did not fall through. In addition, the 10, 20 and 50 day SMAs are all moving higher, although the longer SMAs have a slight upward trajectory.


Here's where my concern kicks in. The advance decline line and the new high low lines aren't confirming the recent rally. This indicates there are a few issues moving the market higher rather than a broad-based advance. That's not a very healthy market.


The Russell 2000

Let's assume the Russell 2000 is a proxy for investors stock market risk tolerance. Here is a chart of the IWM's -- the ETF for the Russell 2000. Notice the ETF is trading just below the 200 day SMA and has been for awhile. Trading below the 200 day SMA is usually considered to be the sign of a bear market. While there has not been major downward movement, the index has not moved higher either. In addition, the short-term SMAs are below the longer-term SMAs -- another bearish sign.

Short version -- we're seeing consolidation just below the 200 day SMA. The markets are waiting for a signal to move one way or the other


Trade Deficit Narrows Slightly; Exports Jump

From Marketwatch:

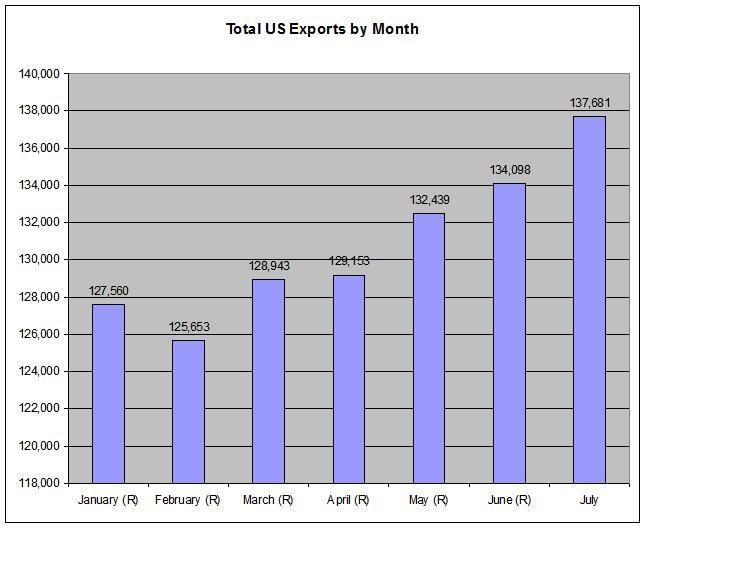
Exports increased 2.7% in nominal terms to $137.7 billion, while imports increased 1.8% to $196.9 billion. Much of the increase in imports was due to higher prices, especially for petroleum and food. The average price of imported crude petroleum was the second highest on record at $65.56 per barrel.

In inflation-adjusted terms, imports of goods rose 0.8%. Inflation-adjusted exports of goods rose 3.7%.

U.S. producers exported record values of capital goods, consumer goods, autos and foods. U.S. consumers imported record values of foods and feeds.


Here's a graph of US exports from the beginning of the year. This is a nice graph. It shows where some of the strength in the underlying economy is.


I would love to see some analysis about the impact of the declining dollar on this number. Here's the weekly chart from stockcharts of the US dollar index.

Market Breadth

Market breadth is a really important indicator of how the overall market is doing. For those of you who want a better idea for this important statistics, please read Profits in the Stock Market by Gartley.

Let's look to a definition from Investorpedia:

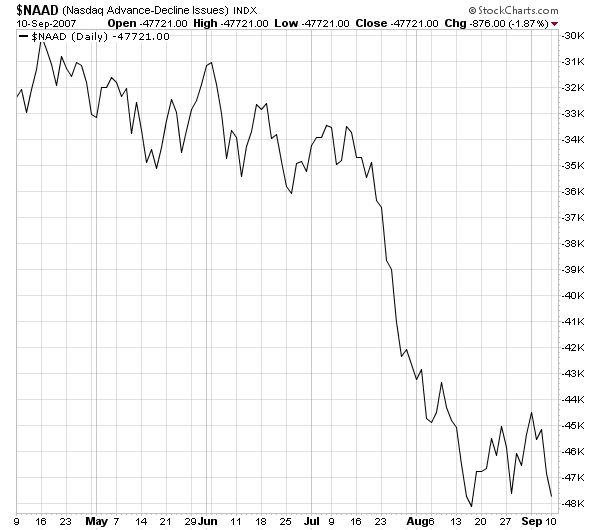
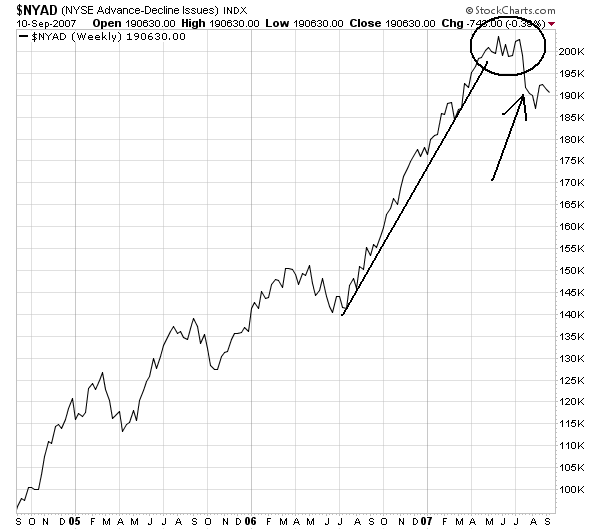
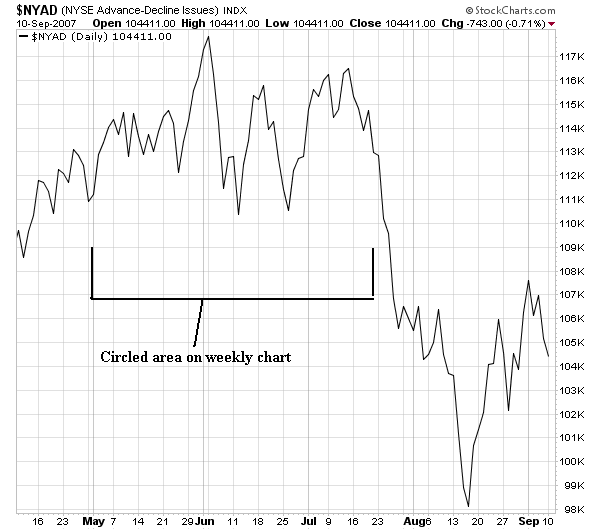
A technical indicator that plots changes in the value of the advance-decline index over a certain time period. Each point on the chart is calculated by taking the difference between the number of advancing/declining issues and adding the result to the previous period's value, as shown by the following formula:

A/D Line = (# of Advancing Stocks - # of Declining Stocks) + Previous Period's A/D Line Value

Investopedia Says... This indicator is used by many traders to confirm the strength of a current trend and its likelihood of reversing. If the markets are up but the A/D line is sloping downwards, it's usually a sign that the markets are losing their breadth and may be setting up to head in the other direction. If the slope of the A/D line is up and the market is trending upward then the market is said to be healthy.


Let's look at the chart to see what they say.

Here's the weekly New York Advance Decline Line:


Here's the daily chart:


Notice the index had a heck of a run for the latest bull run that started in March of last year. However, look at the circled area on the weekly chart and then look at the bracketed area on the daily chart. Notice that in June of last year we started to see the AD line break the upward trend and move sideways. This was a very important development; it indicated the number of declining issues was increasing. This indicates there was an increase in profit taking. By this time the SPYs had risen 124 in July 2006 to 154 in early May 2007 -- an increase of 24%. These two facts -- a strong increase plus a decreasing AD line -- was a pretty good indication of a possible change in overall market sentiment.

Looking at August of this year we really don't see a firm trend emerging in one direction or the other. We've seen dips and rallies, but no trend has emerged in any way. In other words, the market is still trying to figure out where it wants to go. Considering the overall trend of the economy this lack of direction is to be expected.

Monday, September 10, 2007

Today's Markets

The markets had a roller-coaster day. They sold-off in the morning, then formed either a cup and handle or ascending triangle formation around mid-day. They rallied from there, but sold-off pretty heavily at the end, printing a long downward bar on heavy volume in the last 5 minutes. According to the AP, the markets were happy with some of the Fed governor's speeches today. My guess is the article was specifically referring to Janet Yellen's speech:

San Francisco Federal Reserve Bank President Janet Yellen said on Monday that the current turmoil in financial markets has added "appreciably" to downside risks for the U.S. economy.

"Financial market turmoil seems likely to intensify the downturn in housing," and pose a risk to broader economy, especially consumer spending, Yellen said in a speech at the National Association of Business Economics annual meeting.


Here's the two-day 5-minute chart;


Here's the 8-day chart. Notice that although the market sold-off, it wound up closing near important Fibonacci levels from the previous advance.


Finally, here's the daily chart. Over the weekend, I stated I think the market is going to use the 200 SMA as a center of gravity until the Fed's meeting.

The WSJ Sums Up the Fed Governor's Speeches

For those of you keeping score at home:

Here’s a quick run-down of all the recent Fed speeches:

* Hawk St. Louis Fed’s William Poole, Sept. 6: “The extent to which it’s affecting the broader economy…I don’t think we know yet. We shouldn’t take for granted the assumption that the economy is about to take a nose-dive.”

* Hawk Atlanta’s Dennis Lockhart, Sept. 6: “So far, I have not seen hard or soft data that provide conclusive signs that housing problems are spilling over into the broad economy…In my view current readings of inflation represent progress, but not victory. I would like to see inflation sustained at a somewhat lower rate—with emphasis on “sustained.”

* Hawk Philadelphia’s Charles Plosser, Sept. 8: “Going forward, until housing demand picks up and some of the inventory of unsold homes is worked off, residential construction will continue to be a drag on economic growth. I expect this drag to diminish gradually but continue until sometime next year. I believe the most likely outcome is that economic growth will return toward trend later in 2008.”

* Dove San Francisco’s President Janet Yellen, Sept. 10: “I see significant downward pressure based on recent data indicating further weakening in the housing sector and the tightening of financial markets… should the decline in house prices occur in the context of rising unemployment, the risks could be significant… signs of improvement in underlying inflationary pressures are evident in recent data… past experience does show that financial turbulence can be resolved more quickly than seems likely when we’re in the middle of it. Moreover, the effects of these disruptions can turn out to be surprisingly small.”

* Hawk/Dove Mr. Lockhart, Sept. 10: Friday’s employment figures “clearly have to be taken very seriously,” but added that he “would like to see inflation sustained at a somewhat lower rate.”

To recap — that’s three speeches on the side of hawkishness, one that sort of straddles the middle (Mr. Lockhart, today), and another that is mostly dovish, although not strongly so (Ms. Yellin, today), which suggests that market players betting on Fed rate cuts would probably want to lean to the quarter-point area.


Personally, I have no idea what the Fed is going to do. However, there are a ton of positions out there.

There is something that I find extremely interesting -- and this is simply an observation. It seems that various Fed members have more latitude to speak their mind under Bernanke. We are seeing a fairly wide divergence of opinions expressed.

In addition, there does seem to be a concerted effort to demonstrate the Fed does not want to bail-out the Street if the damage has not migrated outside of the financial markets. That tells me they are very aware of the perception that people would have of them granting a pass to all of the stupid credit practices that have occurred over the last few years. I may be reading too much into that (or maybe I want to see that).

Expect More Problems In the Financial Sector

From Bloomberg:

Wall Street is getting no benefit from the biggest bond market rally in five years.

Lehman Brothers Holdings Inc. faces higher borrowing costs today than it did in June, even after the steepest quarterly drop in U.S. Treasury yields since 2002 pushed interest rates down for everyone from Procter & Gamble Co. to AT&T Inc. Investors are so leery of Bear Stearns Cos. that its 10-year bonds trade at a discount to Colombia, the South American nation that's barely investment grade. Goldman Sachs Group Inc. is being punished with a higher yield than Caterpillar Inc., the heavy-equipment maker.

Bond buyers view the nation's largest securities firms as no safer than taking a flier on subprime mortgages. That's a nightmare scenario for the industry's chief executive officers, who relied on cheap financing for leveraged buyouts, real estate lending and proprietary trading to produce record profits -- and paychecks of $40 million or more for themselves.


From the WSJ:

It is crunch time for many of the world's biggest banks grappling with one of the tightest credit markets of recent memory.

About $120 billion of commercial paper outside the U.S. is due for renewal in the next week, including $56.5 billion of asset-backed paper, which has met the stiffest resistance from investors. Issuers need to find buyers in order to roll over these short-term funding mechanisms or pay off the loans. So banks and other issuers are pulling out all stops to lure investors back. In the meantime, they are using short-term moves to raise cash to keep them going.

While there is little sign the market is opening up, a few rays of hope are emerging. In Australia, the central bank has broadened the definition of assets it would accept as collateral for short-term funding it supplies to domestic banks. In the U.S., money-market funds haven't suffered big redemptions and thus still have money to put to work. Investors in these funds also are willing to hold commercial paper for slightly longer time frames, suggesting some stability may be returning, though the funds may find their investors want a limited diet of short-term paper.


Remember that financial shares represent about 20% of the S%P 500. That means their performance could have a very strong impact on the index's overall performance. Here's a chart of the XLF -- the ETF that tracks the financial sector. Notice it is performing very poorly. While the ETF has found support around the $48/area, it hasn't been able to move above $50. Also note the 20 and 50 simple moving averages are trending lower and the ETF is trading about 10% below the 200 day SMA. In other words, this sector is really hurting. News like the two pieces above either add downward pressure or make an upward move extremely difficult, which further hurts the overall index.


Here's a chart of the IAK's -- the ETF that tracks the brokerage industry. Notice that it shares the exact same technical problems as the XLF. More importantly, notice it was very thinly traded until the recent market turmoil when the volume increased in a big way. That's not a positive development.

Sunday, September 9, 2007

The Dollar, The Yen and the Short End of the Curve

There are three charts that are particularly important right now. The dollar may hem the Fed in. The Yen is a proxy for the carry trade. And the SHYs are the ETF that tracks the short end of the Treasury market (1-3 years).

The dollar has been and is in terrible shape. Here is the daily chart. Notice the dollar started selling off in mid-August and is currently testing critical technical levels. The 20 day SMA has an upward trajectory, but recent price action makes the continuation of this trend a near impossibility. In addition, the 50 and 200 day SMAs are moving lower.


The dollar has been in a downtrend for the last year and a half. All of the simple moving averages are heading lower, and the shorter SMAs are below the longer SMAs. Finally, the dollar is below all three SMAs. These last two observations indicate the most likely downward trajectory is down. This could hem the Federal Reserve's policy options, as a drop in interest rates would most likely negatively impact the dollar.


The yen spiked up in mid-August, sold-off on some basic profit taking, then rallied strongly on Friday on the weak employment report. The 20 and 50 day SMAs are all moving higher and the current price action is above these SMAs, indicating a strong possibility of further appreciation.


The long-term chart indicates the yen may be breaking a long-term downtrend. The yen rallied above long-term resistance, consolidated above that line, and then started to advance again. Notice the 20 and 50 SMAs are all making a turn into positive territory. Assuming the carry-trade is disappearing, expect this trend to continue.


The short end of the Treasury started to rally in mid-June. The rally has continued as investors have sought safety and stability in the short-end of the curve.


The short-end of the curve has been rallying for the few years, largely because of the Fed's rate increases.