Saturday, December 30, 2006

Housing in 2007

I agree 110% with Calculated Risk, although I would add the following.

1.) Households have a record amount of total debt right now. It stands about 94% of GDP. I have not seen any number for when household debt is too much -- and I seriously doubt an exact number exists. However, I feel confident that we are near the amount when households have to start paring back on their overall debt levels.

In short -- demand will continue to drop as households move from a house acquisition stance to a "pay down all this debt stance." Declining demand = declining prices.

2.) CR makes an estimate of the amount of overbuilding in the housing market. I would add this information from Bloomberg:

In a Nov. 27 comment, Rosenberg notes that in addition to the record 4.3 million residential units for sale as of October, there were 1.95 million home completions, the 12th-highest month since 1979. Units under construction were through the roof as well. Rather than seeing supply dwindle and prices start to firm up in early 2007, Rosenberg says ``it could be a year before the reduction in starts begins to put a meaningful dent into the inventory backlog.''

John Mauldin, an investment adviser and frequent contributor to Investors Insight, a financial-data publisher, throws an extra log on the fire. According to Mauldin, even the current projection of housing sales may be overstated and thus the existing supply of homes greater than what is reported in the official data. The reason is that the Census Bureau, one of the Commerce Department's statistical agencies, fails to account for cancellations in home sales contracts. Cancellations ran as high as 40 percent for some major homebuilding firms last quarter.


The short version is it appears there is a ton of inventory about to hit the market at a time when there is already a ton of inventory. Excess supply = declining prices.

3.) We know there are between $700 billion and $1 trillion of exotic mortgages" that reset in 2007 (depending on which news story you read). Recent testimony before the Senate Banking Committee expressed concern about what the purchasers of these mortgages knew when they bought these mortgages. We also know these loans are already performing badly and their performance has worsened over the last three years:

Still, despite the adverse conditions, "I guess we are a bit surprised at how fast this has unraveled," said Zimmerman. While it's "not a secret that subprime collateral has performed pretty disastrously so far," he said, "I must say we were a bit surprised by the magnitude with which" the loans "deteriorated this year."

...

Comparing loans of similar age, 2006 loans are performing worse than 2005, which are worse than 2004. In fact, given where delinquencies are now, loans from 2006 are on track to be among the worst-performing ever, along with the 2000 to 2001 years, according to UBS research.


We already have a trend in place: A faster pace of delinquencies and a larger volume of delinquencies earlier in the life of the mortgage. There is no reason to expect this trend to do anything except get worse.

4.) Housing derivatives are out on the market in large numbers. I haven't seen any firm estimates about how these will play out in the coming year -- or if they will play out at all. This could be a nasty stealth story in 2007. For example, a hedge fund that is heavily invested in credit derivatives has the market go against them, or something similar.

So -- the home buyers have a record amount of debt, inventory stands to stay the same and exotic mortgages are already performing badly.

I was originally of the opinion that housing would be hit by an event that would seriously damage the market and move the country into recession. However, I now agree with CR's evaluation that US housing will be more akin to Chinese Water Torture, with a constant drip, drip, drip of bad news for some time.

Friday, December 29, 2006

Your Weekend Weimar

Photobucket - Video and Image Hosting

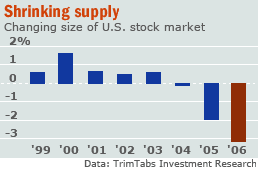
Is the "Shrinking Market" A Reason for the Recent Rally

From CBS MarketWatch

For some observers, this bull market can be partly explained by the fundamentals of supply and demand: The supply, or number of shares outstanding, has declined while demand, in the form of investor optimism, has stabilized and recently begun to increase.

"The more you shrink it, the more it has the potential to rise, all other things being equal," said Rod Smyth, chief investment strategist with Wachovia Securities. "If you're shrinking the market with buyouts, you're putting money back into people's pockets, which in a bull market they're likely to keep re-investing in the market."

More than $400 billion worth of new cash takeovers have been announced this year, while companies bought back in excess of $600 billion worth of their own stock, both records, according to estimates compiled by TrimTabs Investment Research, a Santa Rosa, Calif.-based firm that tracks market trends for institutions.


Simple supply and demand indicates a smaller supply leads to a higher price. Here's a chart of the last few years that shows this year in perspective:

Photobucket - Video and Image Hosting

I've been trying to figure out this rally for the last month or so. Stocks hit record highs during a strong expansion. Yet all of the macro-indicators indicate the economy is slowing. While the current evidence indicates a soft-landing is in place, there are still a few very large wild cards (oil, the dollar and housing) that could tip the US into recession. In short, the macro-numbers don't indicate we should be having stock market records.

The shrinking amount of shares plus the large amount of share buybacks has obvioiusly put a bid in the market.

Chicago PMI "Regains Footing"

From the Release

The Chicago Purchasing Managers reported the Chicago Business Barometer regained its footing to register some improvement.

- Production and New Orders regained strength while the rate of decline in Order Backlogs stabilized;

- Prices Paid were unchanged from November;

- Employment contraction continued as reported layoffs increased while hirings decreased


Let's look a bit deeper into the survey.

The index dropped from September through November, then rebounded in December. We'll have to wait until January to see if this number continues its upward movement.

There was a nice upward move in new orders. But these can always be canceled, so until they get into production this number may be a bit high. Also note this was the seasonally adjusted number. The unadjusted number increased .5 instead of 5.8.

The prices paid component increased slightly. This is not a good sign for the Federal Reserve policy going forward and takes some wind out of the "Fed has to lower rates in the new year" argument.

There were several comments about slowing construction and how that was having a negative impact. There was also a comment about how the lack of a federal budget was hurting overall production. This implies that when a budget resolution is passed, the Chicago PMI could see a 1-month jump. Finally, there was a comment about manufacturing being moved off-shore while financial work was remaining onshore.

Short version: A 1 month improvement that contains some future concerns (prices paid and employment) and will need at least 1-month of upward verification. In other words, this could be a trend reversal, but we need more information going forward.

Thursday, December 28, 2006

Worst May Not Be Over For Housing

From Bloomberg:

In a Nov. 27 comment, Rosenberg notes that in addition to the record 4.3 million residential units for sale as of October, there were 1.95 million home completions, the 12th-highest month since 1979. Units under construction were through the roof as well. Rather than seeing supply dwindle and prices start to firm up in early 2007, Rosenberg says ``it could be a year before the reduction in starts begins to put a meaningful dent into the inventory backlog.''

John Mauldin, an investment adviser and frequent contributor to Investors Insight, a financial-data publisher, throws an extra log on the fire. According to Mauldin, even the current projection of housing sales may be overstated and thus the existing supply of homes greater than what is reported in the official data. The reason is that the Census Bureau, one of the Commerce Department's statistical agencies, fails to account for cancellations in home sales contracts. Cancellations ran as high as 40 percent for some major homebuilding firms last quarter.


The high amount of inventory -- especially of existing homes which has been running over 7 months since July 2006 -- is very disconcerting. The existing homes market is much larger than the new homes market. A declining sales environment is going to make it harder to work off that inventory, which means price declines may not be over.

Richmond Fed Index Decreases

From the Richmond Fed

Tenth District manufacturing activity growth continued to edge down in December, while expectations for future factory activity rebounded strongly from the previous month. Most price indexes in the survey declined, with many indexes recording their lowest levels in over a year.

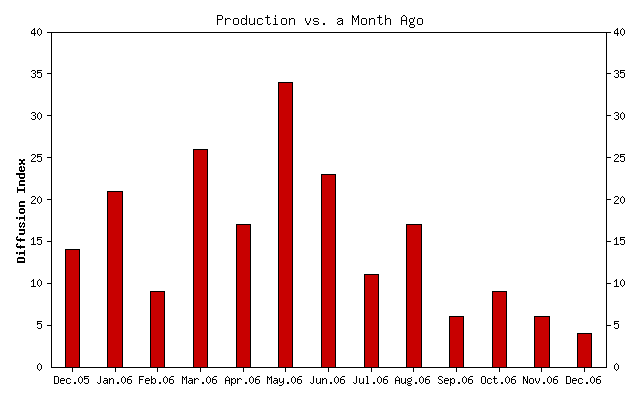
The net percentage of firms reporting month-over-month increases in production in December was 4, down from 6 in November and 9 in October (Tables 1 & 2, Chart). Production decelerated at both durable- and nondurable-goods-producing plants. The year-over-year production index also decreased from 35 to 25, a two-year low. On the other hand, the future production index rebounded from 15 to 27 after four straight months of decline. Although sample sizes make it difficult to draw firm conclusions about individual states, the data available suggest that production remained well above year-ago levels in all district states.


Here is a chart of the overall diffusion index:

Photobucket - Video and Image Hosting

This report is consistent with other Fed area manufacturing reports this month. The general consensus seems to be the current slowdown is temporary. Everyone is expecting orders to pick-up in six months. For example, 49% of respondents think production will increase in 6 months and 50% of respondents think shipments will increase in 6 months. On the inflation expectation front, only 29% of respondents think the prices they receive will increase in 6 months, although 44% think raw material's prices will increase in six months. This may partially explain why only 34% of respondents think they will have more employees in six months. Cutting back on hiring will allow manufacturers to maintain current margins.

Existing Home Sales Increase .6%

From the National Association of Realtors

Total existing-home sales – including single-family, townhomes, condominiums and co-ops – rose 0.6 percent to a seasonally adjusted annual rate of 6.28 million units in November from a level of 6.24 million in October, but were 10.7 percent below the 7.03 million-unit pace in November 2005.


The median price of home sales decreased $1,000 to $218,000 and is down 3.1% YOY.

The average price increased to $1,000 to $265,000 and is down 1.8% YOY.

Inventory dropped to a 7.3 month supply while the YOY increase in inventory is 30.6%.

The big reason for the increase was a 6% jump in the Northeast sales. This is the smallest region sales wise. All other regions were either up slightly (the West was up .8%) unchanged (the Midwest) or down (the South -1.8%).

So -- inventory is still very high and the reason for the increase was a jump in sales in the smallest real estate region in the country.

In other words, this report looks fair but still raises three concerns.

1.) There is still a ton of inventory on the market in a declining YOY sales environment. That means the inventory will be there awhile. So the possibility of a price drop still remains.

2.) Without the NE increase (which I am guessing is partly due to an unseasonably warm winter and is the smallest region in the country by size of sales), this report would have been negative. The next report will indicate how sustainable this increase is but I have some doubts.

3.) The YOY price change is dropping and the median price has dropped each month since July. In other words, prices have no stabilized, although the rate of the median decrease has slowed. So long as prices are dropping and have not stabilized for a few months, calling an absolute bottom in the housing market is probably premature.

Overall, however, this report will give plenty of ammunition to pundits calling the housing market decline over.

Weekly Unemployment +1000

From CBS MarketWatch

The number of U.S. workers filing new applications for state unemployment benefits rose slightly in the latest week while continuing jobless claims climbed to their highest level in almost a year, the Labor Department said Thursday. Initial jobless claims rose by 1,000 in the week ended Dec. 23 to 317,000, the Labor Department said in a report. But in a sign of slackening in the U.S. labor market, continuing claims, or people continuing to collect state unemployment benefits, rose by 16,000, to 2.53 million, in the week ended Dec. 16. It's the highest level since Jan. 28. The four-week average of continuing claims rose to its highest level since Feb. 18, to 2.51 million. The four-week average of initial claims fell by 10,250 to 315,750. This marked the lowest level since the week ended Nov. 11


Let's break this down into bite-sized economic morsels.

Initial jobless claims rose by 1,000 in the week ended Dec. 23 to 317,000, the Labor Department said in a report.

Not a big move. I would consider this statistical noise.

continuing claims, or people continuing to collect state unemployment benefits, rose by 16,000, to 2.53 million, in the week ended Dec. 16. It's the highest level since Jan. 28.

This is not good and shows signs of weakness. We need a bit more information about these people -- what industries employed them, what is their age etc.. -- but this raw number indicates the employment picture is probably weakening.

The four-week average of continuing claims rose to its highest level since Feb. 18, to 2.51 million.

Because the initial numbers jump around a bit, economists use a 4-week average to smooth out the jumps. However, this increase in the 4-week moving average confirms that employment prospects may not be as great as the low unemployment number indicates.

The four-week average of initial claims fell by 10,250 to 315,750. This marked the lowest level since the week ended Nov. 11

This is better news on the short-term front.

Let's look at the news release because there is some important information. Unfortunately it does not paste well into Blogger. So -- go to the page and notice that the number of states with fewer construction lay-offs comes in at 7. Earlier in December there was a rash of states with construction lay-offs. That seems to be slowing down for now which is a good economic sign. However, with a slowing housing market still, we may not be at the end of construction lay-offs.

Oil -- Still Rangebound

Photobucket - Video and Image Hosting

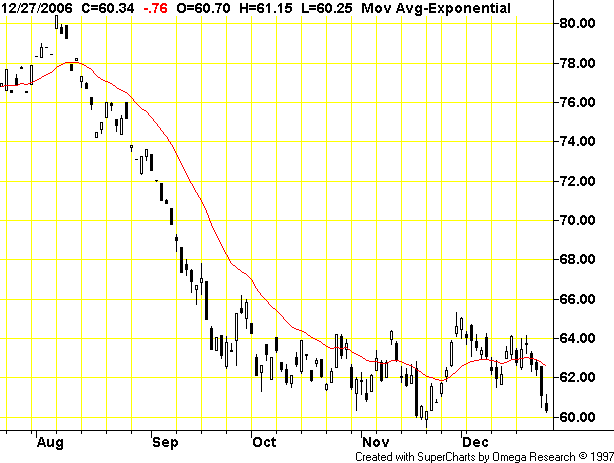
What does this chart tell us? Simple. Supply and demand are near equal. This is a great example of what W.D. Gann would call a distribution pattern. A distribution pattern occurs when a security is at the top of its respective chart or in the middle of a decline and the price starts trading sideways in a trading range. Traders who own the security start to distribute to to willing buyers over a period of time for whatever reason. Here's a monthly chart to show where oil is in the bigger picture.

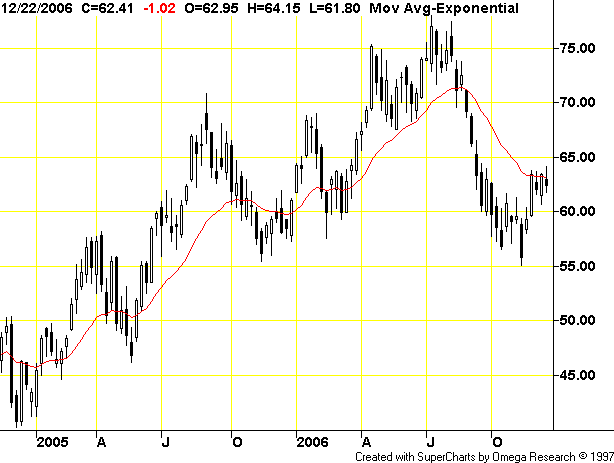
Photobucket - Video and Image Hosting

Notice how oil has twice gravitated to the $60/bbl level in the last year -- once in late 2005 when it traded just below $60/bbl and once in the early part of 2006 when oil traded just above $60/bbl. Clearly this is an important price for the oil market.

Oil has clearly broken its long-term uptrend of the last year. Now the question becomes where will oil go from here? Pulling the price down is a mild US winter and slowing US economic growth which lowers overall oil demand. On the up side we still have China growing around 10%, India picking up economic steam and the OPEC production cut. My best guess (and yes it really is just an educated guess) is until the market gets a clearer signal either way it will remain in this range.

Wednesday, December 27, 2006

Declining Volume -- Correction or Seasonal?

Photobucket - Video and Image Hosting

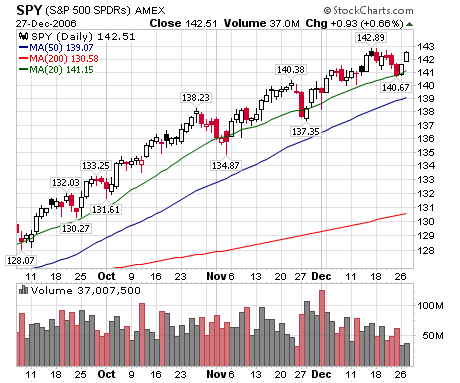
The SPY's volume has been declining since December 11. We've seen lower highs and lower lows.

Photobucket - Video and Image Hosting

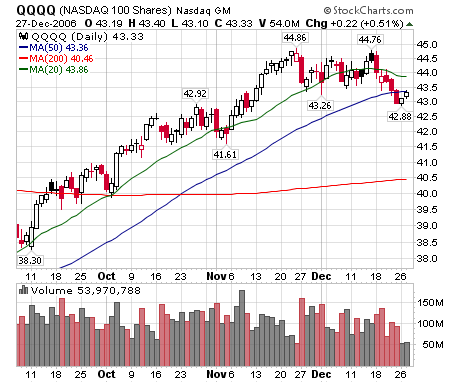
The QQQQ's volume has declined since December 18. Also note the QQQQs are bumping into the 20-day simple moving average.

The end of December is essentially a Wall Street holiday, so declining volume could simply be a sign of early vacations and nothing more. But declining volume can also be a sign a waning buying interest.

Food for thought.

A Must Read

This Big Picture Article. No really -- you must read it

New Home Sales Up 3.4%*

From Bloomberg:

Sales of new homes in the U.S. rose more than forecast last month as lower mortgage rates and more incentives helped builders reduce inventory.

The 3.4 percent increase to an annual pace of 1.047 million in November followed a 1.013 million rate the prior month that was faster than previously reported, the Commerce Department said today in Washington. The supply of unsold homes at the current sales pace fell to the lowest since May.

The figures add to evidence that the slowdown in construction may take less of toll on the economy early next year than it did last quarter. Even with the decline last month, the number of unsold homes remains near a record high, making it less likely homebuilding will strengthen outright, limiting economic growth, economists said.


A couple of points in no order of importance.

1.) The Census Bureau says the margin of error for this number is plus or minus 12.9%. That's a margin of guessing, not error.

2.) Number 1 being said, consider that October was revised higher:

Sales of new homes rose 3.5% in November to a seasonally adjusted annual rate of 1.047 million, the Commerce Department reported Wednesday. Sales are now down 15.3% in the past year. October's sales pace was revised to 1.013 million from an earlier-estimated 1.004 million. The median sales price of a new home rose to $251,700 from $243,800. Economists surveyed by MarketWatch were expecting sales to rise to a seasonally adjusted annual rate of 1.02 million from the previous 1.00 million


That's impressive. And frankly, I have to admit to being taken back by the upward revision.

Low interest rates are the primary reason for the increase:

Slower-than-expected growth in recent months has pushed Treasury yields lower, holding the rate on 30-year fixed mortgages to under 6.2 percent for the last month, compared with a high for the year of 6.8 percent reached in July. The Mortgage Bankers' Association's index of purchase applications are up almost 4 percent from a three-year low reached at the end of October.


3.) The median price increased. However, there is no mention of the effect of builder incentives on prices. I would like to see more information on the depth and breadth of builder incentives.

If this number holds, this is good news for the economy.

UAE Selling Dollars For Euros

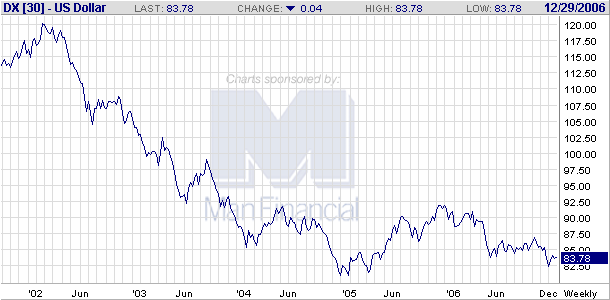
Take a good look at this 4-year chart for the dollar:

Photobucket - Video and Image Hosting

This is what happens when you run trade and fiscal deficits. Countries start to lose confidence in your currency. Over the last few years we have seen a large number of central banks announce they will diversify away from the dollar -- usually to add the euro to their reserves. OPEC, Russia, China, South Korea, Iran, and Venezueala are all in this camp. Now we can add the UAE to the "we like euros as much as the dollar" camp.

The United Arab Emirates will convert 8 percent of its foreign-exchange reserves to euros from dollars before September after the U.S. currency slumped this year, the country's central bank governor said.

The U.A.E. has started ``in a limited way'' to sell part of its dollar reserves, Sultan Bin Nasser al-Suwaidi said in an interview in Abu Dhabi on Dec. 24. ``We will accumulate euros each time the market appears to dip,'' as part of a plan to expand the country's holding of euros to 10 percent of the total from 2 percent today, he said.

The Gulf state is among oil producers including Iran, Venezuela and Indonesia, looking to shift their currency reserves into euros or sell their oil, which is currently priced in dollars, in the 12-nation currency. The total value of the U.A.E.'s current reserves is $24.9 billion, 98 percent in dollars and 2 percent in euros, al-Suwaidi said.


Standard economic thinking would argue the US trade deficit should lead to a dollar correction. The problem is when a large number of people start to sell dollars. Right now there is a giant international game of chicken going on -- no one wants to be the one who starts a dollar drop, but no one wants to see the value of their reserves decrease either. It's a most difficult game that can lead to sudden and painful currency moves.

Tuesday, December 26, 2006

Holiday Sales Increase 3%

From Bloomberg:

U.S. holiday retail sales rose a disappointing 3 percent from 2005 as a slowing housing market and higher energy costs cut into spending, MasterCard Advisors said.

The gain is less than the 5.2 percent increase last year and the smallest growth since the survey started in 2003, MasterCard Advisors said today in a statement. Electronics and luxury goods had the strongest sales, according to the company's SpendingPulse survey.

``Retailers are going to find that this was a pretty modest Christmas season,'' Britt Beemer, chairman of Charleston, South Carolina-based America's Research Group, said in an interview.


This report is not good news. Retailers make about 1/3 of their profits during the Christmas season. This also does not bode well for the coming year. Consumer spending comprises 70% of US GDP growth. If the consumer starts to spend less, we'll have a second negative hit to GDP growth -- the first being housing.

Richmond Fed Slows

From the Richmond Federal Reserve

In December, the seasonally adjusted manufacturing index—our broadest measure of manufacturing activity—decreased to -6 from November’s reading of 7. Among the index’s components, shipments lost ten points to -4, new orders fell fourteen points to -8 and the jobs index moved down fifteen points to -5.

Other indicators also suggested weaker activity. The capacity utilization index turned negative, losing twelve points to finish at -11 and the orders backlogs indicator shed five points to -16. Vendor delivery times edged down three points to -1, while our gauge for raw materials inventories was somewhat higher, gaining six points to 20. The finished goods inventories index, however, trimmed three points to 12.

Both raw materials and finished goods prices grew at a quicker pace in December. Looking ahead, respondents expected raw materials prices to rise faster over the next six months.


The overall index -- along with various individual components -- decreased at the end of 2004 and early 2005. In other words, this might be a year-end slowdown and nothing more. However, the overall economic environment was far different at the end of 2004. Over the last year we have had a slowing housing market, a record trade deficit and slowing (although fairly respectable) employment growth.

The three-month average of the new orders index, overall manufacturing activity and shipments has decreased for the last 6 months. This indicates the slowdown could be a natural situation where manufacturing customers made a large number of purchases six months ago and are now working off the inventory from those purchases. However -- as with the previous statement -- the overall economy situation right now is one of a general slowdown.

Fed watchers -- bear witness to the increased prices paid and prices charged numbers. These indicate the PPI from December may not be a fluke.

The Richmond Fed also released a services report today

According to the latest survey by the Federal Reserve Bank of Richmond, revenue growth in the broad service sector slowed in December. Retail sales contracted slightly in December, although sales results from the final weekend before Christmas are not included in this month's survey. Big-ticket sales led the decline in December, but the pace moderated from that of a month ago. Retail inventories fell for the first time in six months, though the contraction was mild. Shopper traffic also slipped, and retailers were less optimistic about sales expectations for the first half of 2007. In contrast, contacts at service-producing firms said revenues grew at a faster pace in December, and they continued to have a bright outlook for the next six months.


The fact that the last weekend before Christmas isn't included makes this survey very suspect in my opinion. Holiday sales have become more and more a last-minute activity over the last few years.

Travel Day

I'm traveling today. I'll try and post about the Richmond Fed when it comes out.

Also -- keep an eye on all three exchange traded funds -- the QQQQs, the SPYs and the DIAs. All closed on Friday in weak technical positions.

Sunday, December 24, 2006

The Coming Week

This will be a light trading week. The week between Christmas and New Years is typically a long holiday where traders only come in to work to catch-up on paperwork rather than actively trade.

However, the markets may be turning over right now. So a light trading week could mean technical problems for the market.

We have new home sales on Wednesday and Existing home sales on Thursday.

The Chicago Purchasing Manager's index comes out on Friday. This will be important especially in light of last week's weak Philadelphia number.